Make no mistake about it; there is no shortage of issues to work through in this market. In short, this is what corrective phases are all about – dealing with the “new normal” when things change. Remember, the stock market is a discounting mechanism of future expectations. And I think we can all agree that the future is anything but certain at the present time. So, this morning, I thought I’d run through the areas of concern and see if we can’t make some sense of this volatile, up-one-minute, down-the-next market environment.
As far as the changes traders are attempting to deal with go, we’ve got geopolitics, the Fed, interest rates, and an oldie, but a goodie, inflation.
Will He, or Won’t He?
Let’s start with the topic of geopolitics, which is a polite term for the potential for armed conflict. Unless you’ve been living under a rock, you are likely aware of the fact that Russia has amassed a military strike force along the Ukraine border. Although President Putin has assured political leaders that he has no intention of invading his former Soviet neighbor, everybody knows that outright lying is just part of the game here.
From a market perspective it is important to keep in mind that this is not Russia’s first go round with Ukraine or adding back real estate to the Russian empire. If you will recall, Putin effectively annexed Crimea a few years back and after some initial gyrations, the market basically yawned.
However, this time, the stage is bigger as NATO is united in trying to keep Russian from annexing any more acreage. And then, just to keep things interesting, Putin has been cozying up to China’s Xi Jinping lately. So, it isn’t much of a stretch to see the potential for the current mess to evolve into a broad conflict.
So, when both the UK and US governments announced Friday that it was time for citizens of the respective countries to leave Ukraine now – as in, RIGHT NOW! – it wasn’t surprising to see the stock market sell off. Especially on a Friday with the potential for weekend headline risk.
Will Putin invade? And if he does, what will be the world’s response? Will this evolve into WWIII? Obviously, nobody knows, but the situation does create a bit of uncertainty. And we all know how Ms. Market hates uncertainty.
Not Worse
Next up is the subject/issue of inflation. Although nobody really expected the CPI report to be a positive input last week, it looked to me like traders took the 7.5% CPI increase in stride on Thursday morning.
Maybe it was the idea that the print wasn’t worse. Maybe traders were thinking the reading marked the peak in the current surge. And/or maybe it was the realization that the gain had been goosed by the fact that the weightings in the inflation index were rebalanced in January (which, according to analysts, added 0.2% to the latest CPI reading).
But in any event, after an initial decline at the open, stocks actually rallied on Thursday morning. But that was before we heard from Mr. Bullard.
Bully, Bully
Moving on, probably the issue having the biggest impact on markets is something I like to call Fed Expectations. I.E. What the Fed plans to do next. Which, in this case, pertains to the highest levels of inflation in 40 years.
Coming into last week, the markets appeared to be getting comfy with the idea of four rate hikes of 0.25% each and the start of QT (Quantitative Tightening – I.E. the Fed selling bonds from its “balance sheet”) sometime this year. Yes, the correction in stocks has been largely due to the Fed changing course. But, as I’ve opined a time or twenty, the stock market can “handle” just about anything, once it comes to grips with the reality of the change. And from my seat, at the start of last week it looked as if stocks were settling in with the Fed Expectations.
But that was before the highest CPI print since 1982. And that was before St. Louis Fed President James Bullard told us what he’d like to see in terms of rate hikes and QT. Both of which surprised the market.
It wasn’t the idea of a 0.50% rate hike in March that got sellers’ attention. No, there had been talk of 50 bps for some time. And it wasn’t the idea of more rate hikes. Nope, lots of analysts had been calling for 5-7 rate hikes prior to Thursday – something that had been shrugged off as an extreme notion – before last week, that is.
It appeared that it was the fact that a Fed official was talking about a 0.50% rate hike (in March, no less) that caused the stir. Oh, and then Bullard went on to say that he’d like to see (a) rates increased by 1.0% by July, (b) QT to start in Q2, and (c) maybe an “inter-meeting” rate hike or two. Yowza.
It will suffice to say these headlines caught markets by surprise. In response, rates spiked, with the yield on the 10-year moving above 2%. And before you could look up the last time the 10-year had been above 2% (it was pre-pandemic, in 2019), the major indices stepped lively from green to red.
Suddenly, the fears of the Fed going too far, too fast were back. Suddenly fears about the state of the economy and, in turn, corporate earnings were making the rounds again. And just like that, the feel-good rebound in stocks that had some talking about new highs by spring, had ended.
Choppy Seas Ahead
The good news is that from a big-picture perspective, the stock market action is in keeping with historical analogs. For example, 1994 was the last time the Fed was in the midst of a rate hike campaign and actually did an “inter-meeting” rate hike. And 2015 was the last time the Fed was on the “normalization” trail, hiking rates six times, if memory serves.
So, what happened to the stock market during these times? A sideways period of consolidation, that’s what. A trading range of between 10% and 15%.
Looking at the current market, the recent high on the S&P 500 was around 4800. The recent low was approximately 4320. Doing the math, that’s exactly a 10% spread. As such, I can argue that the recent high and low represent the logical bounds to future trading as investors adjust/adapt and effectively “get comfortable” with the new normal environment.
To be sure, the action is likely to remain volatile. As you know, markets move faster than ever these days. But, if the current low end of the range holds up during any further “downside price exploration,” I, for one, will be looking to “ride the range” with any discretionary cash in portfolios.
Now let’s take a look the “state of the market” through the lens of our market models…
The Big-Picture Market Models
We start with six of our favorite long-term market models. These models are designed to help determine the “state” of the overall market.
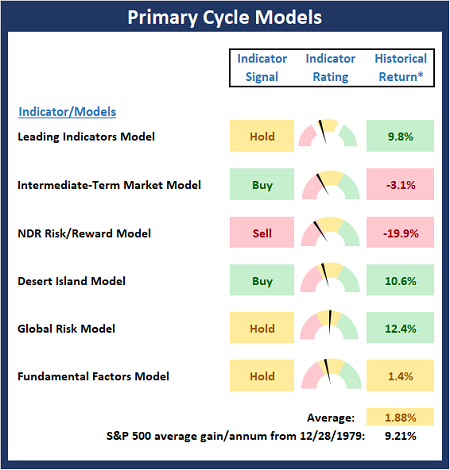
* Source: Ned Davis Research (NDR) as of the date of publication. Historical returns are hypothetical average annual performances calculated by NDR.
The Fundamental Backdrop
Next, we review the market’s fundamental factors including interest rates, the economy, earnings, inflation, and valuations.
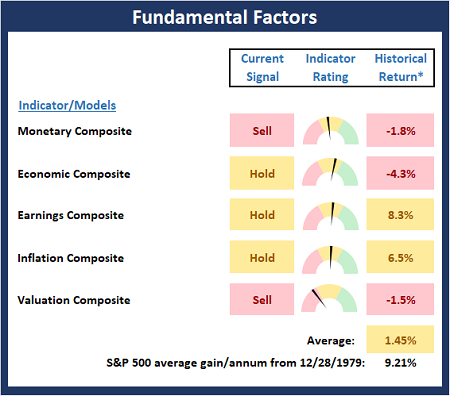
* Source: Ned Davis Research (NDR) as of the date of publication. Historical returns are hypothetical average annual performances calculated by NDR.
The State of the Trend
After reviewing the big-picture models and the fundamental backdrop, I like to look at the state of the current trend. This board of indicators is designed to tell us about the overall technical health of the market’s trend.
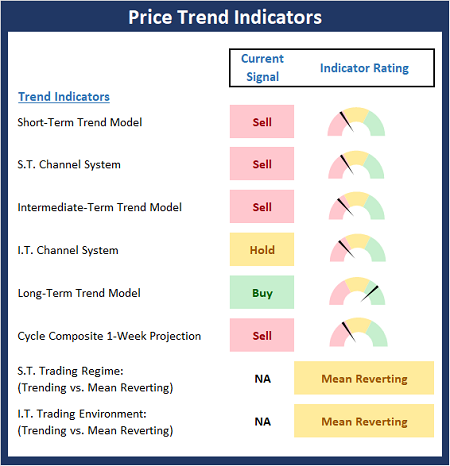
The State of Internal Momentum
Next, we analyze the momentum indicators/models to determine if there is any “oomph” behind the current move.
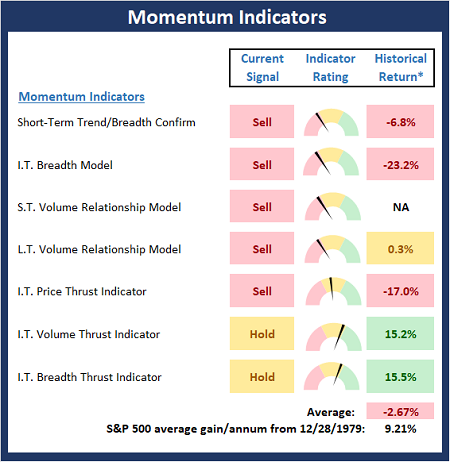
* Source: Ned Davis Research (NDR) as of the date of publication. Historical returns are hypothetical average annual performances calculated by NDR.
Early Warning Indicators
Finally, we look at our early warning indicators to gauge the potential for countertrend moves. This batch of indicators is designed to suggest when the table is set for the trend to “go the other way.”
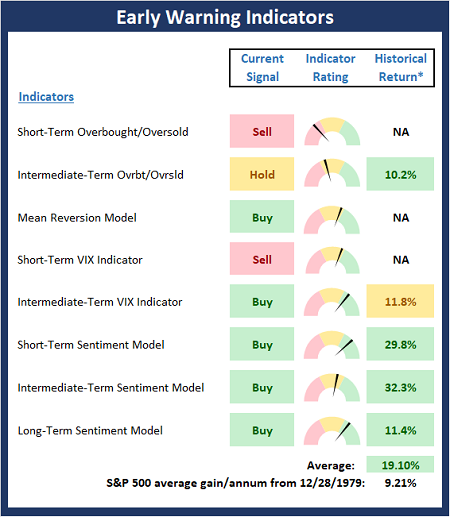
* Source: Ned Davis Research (NDR) as of the date of publication. Historical returns are hypothetical average annual performances calculated by NDR.
Thought for the Day:
A volunteer is worth twenty pressed men -English Proverb
Market Models Explained
Wishing you green screens and all the best for a great day,

David D. Moenning
Director Institutional Consulting
Capital Advisors 360, LLC

Disclosures
At the time of publication, Mr. Moenning held long positions in the following securities mentioned:
None
– Note that positions may change at any time.
NOT INDIVIDUAL INVESTMENT ADVICE. IMPORTANT FURTHER DISCLOSURES
Tags: David Moenning, State of the Markets, Stock Market, Stocks, Stock Market Commentary, Stock Market Analysis, Investing


Institutional Consulting
David Moenning
Working Through The Issues
Make no mistake about it; there is no shortage of issues to work through in this market. In short, this is what corrective phases are all about – dealing with the “new normal” when things change. Remember, the stock market is a discounting mechanism of future expectations. And I think we can all agree that the future is anything but certain at the present time. So, this morning, I thought I’d run through the areas of concern and see if we can’t make some sense of this volatile, up-one-minute, down-the-next market environment.
As far as the changes traders are attempting to deal with go, we’ve got geopolitics, the Fed, interest rates, and an oldie, but a goodie, inflation.
Will He, or Won’t He?
Let’s start with the topic of geopolitics, which is a polite term for the potential for armed conflict. Unless you’ve been living under a rock, you are likely aware of the fact that Russia has amassed a military strike force along the Ukraine border. Although President Putin has assured political leaders that he has no intention of invading his former Soviet neighbor, everybody knows that outright lying is just part of the game here.
From a market perspective it is important to keep in mind that this is not Russia’s first go round with Ukraine or adding back real estate to the Russian empire. If you will recall, Putin effectively annexed Crimea a few years back and after some initial gyrations, the market basically yawned.
However, this time, the stage is bigger as NATO is united in trying to keep Russian from annexing any more acreage. And then, just to keep things interesting, Putin has been cozying up to China’s Xi Jinping lately. So, it isn’t much of a stretch to see the potential for the current mess to evolve into a broad conflict.
So, when both the UK and US governments announced Friday that it was time for citizens of the respective countries to leave Ukraine now – as in, RIGHT NOW! – it wasn’t surprising to see the stock market sell off. Especially on a Friday with the potential for weekend headline risk.
Will Putin invade? And if he does, what will be the world’s response? Will this evolve into WWIII? Obviously, nobody knows, but the situation does create a bit of uncertainty. And we all know how Ms. Market hates uncertainty.
Not Worse
Next up is the subject/issue of inflation. Although nobody really expected the CPI report to be a positive input last week, it looked to me like traders took the 7.5% CPI increase in stride on Thursday morning.
Maybe it was the idea that the print wasn’t worse. Maybe traders were thinking the reading marked the peak in the current surge. And/or maybe it was the realization that the gain had been goosed by the fact that the weightings in the inflation index were rebalanced in January (which, according to analysts, added 0.2% to the latest CPI reading).
But in any event, after an initial decline at the open, stocks actually rallied on Thursday morning. But that was before we heard from Mr. Bullard.
Bully, Bully
Moving on, probably the issue having the biggest impact on markets is something I like to call Fed Expectations. I.E. What the Fed plans to do next. Which, in this case, pertains to the highest levels of inflation in 40 years.
Coming into last week, the markets appeared to be getting comfy with the idea of four rate hikes of 0.25% each and the start of QT (Quantitative Tightening – I.E. the Fed selling bonds from its “balance sheet”) sometime this year. Yes, the correction in stocks has been largely due to the Fed changing course. But, as I’ve opined a time or twenty, the stock market can “handle” just about anything, once it comes to grips with the reality of the change. And from my seat, at the start of last week it looked as if stocks were settling in with the Fed Expectations.
But that was before the highest CPI print since 1982. And that was before St. Louis Fed President James Bullard told us what he’d like to see in terms of rate hikes and QT. Both of which surprised the market.
It wasn’t the idea of a 0.50% rate hike in March that got sellers’ attention. No, there had been talk of 50 bps for some time. And it wasn’t the idea of more rate hikes. Nope, lots of analysts had been calling for 5-7 rate hikes prior to Thursday – something that had been shrugged off as an extreme notion – before last week, that is.
It appeared that it was the fact that a Fed official was talking about a 0.50% rate hike (in March, no less) that caused the stir. Oh, and then Bullard went on to say that he’d like to see (a) rates increased by 1.0% by July, (b) QT to start in Q2, and (c) maybe an “inter-meeting” rate hike or two. Yowza.
It will suffice to say these headlines caught markets by surprise. In response, rates spiked, with the yield on the 10-year moving above 2%. And before you could look up the last time the 10-year had been above 2% (it was pre-pandemic, in 2019), the major indices stepped lively from green to red.
Suddenly, the fears of the Fed going too far, too fast were back. Suddenly fears about the state of the economy and, in turn, corporate earnings were making the rounds again. And just like that, the feel-good rebound in stocks that had some talking about new highs by spring, had ended.
Choppy Seas Ahead
The good news is that from a big-picture perspective, the stock market action is in keeping with historical analogs. For example, 1994 was the last time the Fed was in the midst of a rate hike campaign and actually did an “inter-meeting” rate hike. And 2015 was the last time the Fed was on the “normalization” trail, hiking rates six times, if memory serves.
So, what happened to the stock market during these times? A sideways period of consolidation, that’s what. A trading range of between 10% and 15%.
Looking at the current market, the recent high on the S&P 500 was around 4800. The recent low was approximately 4320. Doing the math, that’s exactly a 10% spread. As such, I can argue that the recent high and low represent the logical bounds to future trading as investors adjust/adapt and effectively “get comfortable” with the new normal environment.
To be sure, the action is likely to remain volatile. As you know, markets move faster than ever these days. But, if the current low end of the range holds up during any further “downside price exploration,” I, for one, will be looking to “ride the range” with any discretionary cash in portfolios.
Now let’s take a look the “state of the market” through the lens of our market models…
The Big-Picture Market Models
We start with six of our favorite long-term market models. These models are designed to help determine the “state” of the overall market.
* Source: Ned Davis Research (NDR) as of the date of publication. Historical returns are hypothetical average annual performances calculated by NDR.
The Fundamental Backdrop
Next, we review the market’s fundamental factors including interest rates, the economy, earnings, inflation, and valuations.
* Source: Ned Davis Research (NDR) as of the date of publication. Historical returns are hypothetical average annual performances calculated by NDR.
The State of the Trend
After reviewing the big-picture models and the fundamental backdrop, I like to look at the state of the current trend. This board of indicators is designed to tell us about the overall technical health of the market’s trend.
The State of Internal Momentum
Next, we analyze the momentum indicators/models to determine if there is any “oomph” behind the current move.
* Source: Ned Davis Research (NDR) as of the date of publication. Historical returns are hypothetical average annual performances calculated by NDR.
Early Warning Indicators
Finally, we look at our early warning indicators to gauge the potential for countertrend moves. This batch of indicators is designed to suggest when the table is set for the trend to “go the other way.”
* Source: Ned Davis Research (NDR) as of the date of publication. Historical returns are hypothetical average annual performances calculated by NDR.
Thought for the Day:
A volunteer is worth twenty pressed men -English Proverb
Market Models Explained
Wishing you green screens and all the best for a great day,
David D. Moenning
Director Institutional Consulting
Capital Advisors 360, LLC
Disclosures
At the time of publication, Mr. Moenning held long positions in the following securities mentioned:
None
– Note that positions may change at any time.
NOT INDIVIDUAL INVESTMENT ADVICE. IMPORTANT FURTHER DISCLOSURES
Tags: David Moenning, State of the Markets, Stock Market, Stocks, Stock Market Commentary, Stock Market Analysis, Investing
RECENT ARTICLES
The Time Has Come
The Market Panic Playbook
Bears Get Back In The Game
Sell in May, Except…
When Being Completely Wrong Works Out
Stronger For Longer?
Archives
Archives