I remained in vacation mode over the weekend and tried my best to stay away from the computers. And since I’m now attempting to dig out upon re-entry, I’m going to let the market models do most of the talking this morning.
In brief, I believe the stock market remains in what I’ll call “digestion” mode. A fancier term might be a reconciliation phase. However from my seat, stocks appear to be “working through” a host of issues including record-breaking earnings, improved earnings expectations, the outlook for future economic growth, the surge in new COVID cases (thanks to the Delta variant and the anti-vaxxers), ongoing supply chain interruptions/shortages, employer/employee sentiment, the prospects for inflation, expectations for Fed’s policy changes, weak breadth/momentum in the market action, slow summer volumes, and the historical cycles. The latter items suggests the market could enter a period of “indigestion.”
But, don’t look now fans, the S&P 500 starts the week at record highs. As such, for me the bottom line here is that (a) this is a bull market until proven otherwise, (b) stocks like to climb a wall of worry, and (c) we should continue to give the bulls the benefit of any doubt for now. (Although I will admit to keeping a little dry powder on hand right now – just in case Ms. Market follows the historical script for the next couple of months.)
Here’s hoping you have a great week. Now let’s review our indicator boards…
The Big-Picture Market Models
We start with six of our favorite long-term market models. These models are designed to help determine the “state” of the overall market.
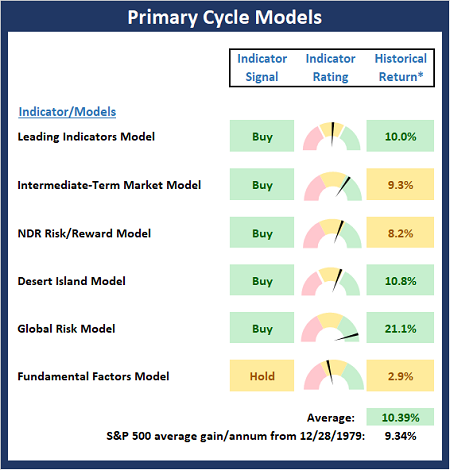
* Source: Ned Davis Research (NDR) as of the date of publication. Historical returns are hypothetical average annual performances calculated by NDR.
The Fundamental Backdrop
Next, we review the market’s fundamental factors including interest rates, the economy, earnings, inflation, and valuations.
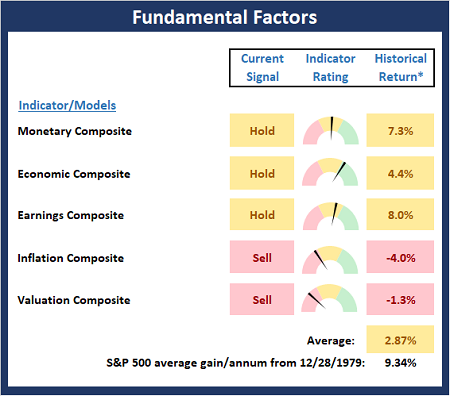
* Source: Ned Davis Research (NDR) as of the date of publication. Historical returns are hypothetical average annual performances calculated by NDR.
The State of the Trend
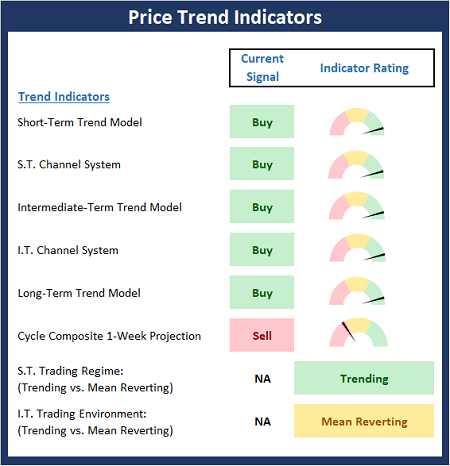
After reviewing the big-picture models and the fundamental backdrop, I like to look at the state of the current trend. This board of indicators is designed to tell us about the overall technical health of the market’s trend.
The State of Internal Momentum
Next, we analyze the momentum indicators/models to determine if there is any “oomph” behind the current move.
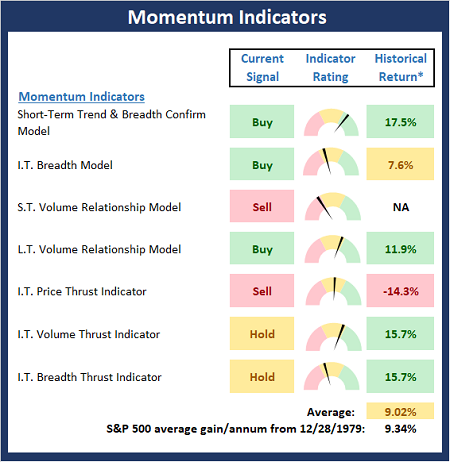
* Source: Ned Davis Research (NDR) as of the date of publication. Historical returns are hypothetical average annual performances calculated by NDR.
Early Warning Signals
Finally, we look at our early warning indicators to gauge the potential for counter-trend moves. This batch of indicators is designed to suggest when the table is set for the trend to “go the other way.”
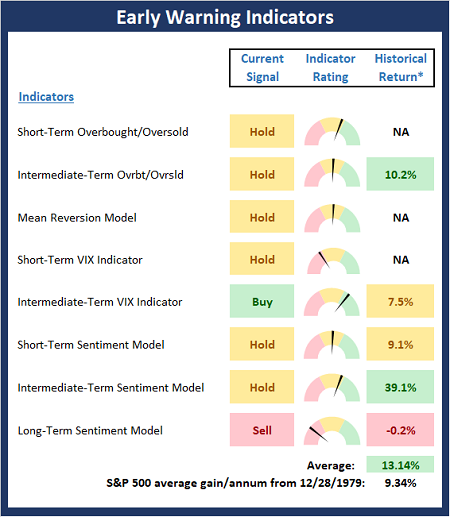
* Source: Ned Davis Research (NDR) as of the date of publication. Historical returns are hypothetical average annual performances calculated by NDR.
Thought for the Day:
He who asks is a fool for five minutes, but he who does not ask remains a fool forever. – Chinese Proverb
Market Models Explained
Wishing you green screens and all the best for a great day,

David D. Moenning
Director Institutional Consulting
Capital Advisors 360, LLC

Disclosures
At the time of publication, Mr. Moenning held long positions in the following securities mentioned:
None
– Note that positions may change at any time.
NOT INDIVIDUAL INVESTMENT ADVICE. IMPORTANT FURTHER DISCLOSURES
Tags: David Moenning, State of the Markets, Stock Market, Stocks, Stock Market Commentary, Stock Market Analysis, Investing


Institutional Consulting
David Moenning
Will Stocks Soon Experience Indigestion?
I remained in vacation mode over the weekend and tried my best to stay away from the computers. And since I’m now attempting to dig out upon re-entry, I’m going to let the market models do most of the talking this morning.
In brief, I believe the stock market remains in what I’ll call “digestion” mode. A fancier term might be a reconciliation phase. However from my seat, stocks appear to be “working through” a host of issues including record-breaking earnings, improved earnings expectations, the outlook for future economic growth, the surge in new COVID cases (thanks to the Delta variant and the anti-vaxxers), ongoing supply chain interruptions/shortages, employer/employee sentiment, the prospects for inflation, expectations for Fed’s policy changes, weak breadth/momentum in the market action, slow summer volumes, and the historical cycles. The latter items suggests the market could enter a period of “indigestion.”
But, don’t look now fans, the S&P 500 starts the week at record highs. As such, for me the bottom line here is that (a) this is a bull market until proven otherwise, (b) stocks like to climb a wall of worry, and (c) we should continue to give the bulls the benefit of any doubt for now. (Although I will admit to keeping a little dry powder on hand right now – just in case Ms. Market follows the historical script for the next couple of months.)
Here’s hoping you have a great week. Now let’s review our indicator boards…
The Big-Picture Market Models
We start with six of our favorite long-term market models. These models are designed to help determine the “state” of the overall market.
* Source: Ned Davis Research (NDR) as of the date of publication. Historical returns are hypothetical average annual performances calculated by NDR.
The Fundamental Backdrop
Next, we review the market’s fundamental factors including interest rates, the economy, earnings, inflation, and valuations.
* Source: Ned Davis Research (NDR) as of the date of publication. Historical returns are hypothetical average annual performances calculated by NDR.
The State of the Trend
After reviewing the big-picture models and the fundamental backdrop, I like to look at the state of the current trend. This board of indicators is designed to tell us about the overall technical health of the market’s trend.
The State of Internal Momentum
Next, we analyze the momentum indicators/models to determine if there is any “oomph” behind the current move.
* Source: Ned Davis Research (NDR) as of the date of publication. Historical returns are hypothetical average annual performances calculated by NDR.
Early Warning Signals
Finally, we look at our early warning indicators to gauge the potential for counter-trend moves. This batch of indicators is designed to suggest when the table is set for the trend to “go the other way.”
* Source: Ned Davis Research (NDR) as of the date of publication. Historical returns are hypothetical average annual performances calculated by NDR.
Thought for the Day:
He who asks is a fool for five minutes, but he who does not ask remains a fool forever. – Chinese Proverb
Market Models Explained
Wishing you green screens and all the best for a great day,
David D. Moenning
Director Institutional Consulting
Capital Advisors 360, LLC
Disclosures
At the time of publication, Mr. Moenning held long positions in the following securities mentioned:
None
– Note that positions may change at any time.
NOT INDIVIDUAL INVESTMENT ADVICE. IMPORTANT FURTHER DISCLOSURES
Tags: David Moenning, State of the Markets, Stock Market, Stocks, Stock Market Commentary, Stock Market Analysis, Investing
RECENT ARTICLES
The Time Has Come
The Market Panic Playbook
Bears Get Back In The Game
Sell in May, Except…
When Being Completely Wrong Works Out
Stronger For Longer?
Archives
Archives