I am finishing up a long weekend visit with family in Santa Fe this morning, so I’m going to keep today’s missive short and sweet. My current take is that markets remain in a consolidation mode and are now in the process of digesting/adjusting to the new info from last week’s Fed meeting, which was certainly interesting.
In case you missed it, the Fed meeting, which is now being referred to as the “talking about talking about” meeting, provided something for markets to chew on. And the resulting reaction wasn’t what one might have expected – especially in the bond arena.
The good news is Powell & Co. finally recognized that inflation is running hotter than expected and could possibly persist longer than previously thought. As such, they also admitted that they may need to start “talking about tapering” the amount of bonds the central bank is buying each month. In addition, the thinking is that the timeframe for when rate hikes could begin will be pulled forward.
And then St Louis Fed President James Bullard moved the needle a bit more on Friday by saying that he could see the first rate hikes in 2022 (and lest we forget, James Bullard is a voting member again next year). This definitely caught some folks off guard as the consensus thinking had been that there wouldn’t be any rate hikes next year.
As a result, the “reopening” stocks dove hard while the dependable earnings names fared better. This certainly makes sense as there may be some fear that the Fed may be pulling the punch bowl prematurely.
However, what doesn’t make much sense – at least from a conventional thinking standpoint – is the action in the bond market. While yields initially rose after the Fed meeting, they quickly turned around and have been sinking ever since. Don’t look now fans, but the yield on 30-year has embarked on a downtrend and the 10-year is threatening to do the same by closing Friday at the lowest level since March.
Although this may sound a bit convoluted, the idea is the bond market isn’t buying the Fed’s narrative about tapering. You see, it is important to keep in mind that US Govt is proposing to spend a LOT of money this fiscal year. For example, the Biden administration has proposed a $6 trillion budget for 2022. This will mean there will be a LOT more bonds to sold/bought.
So, since the Fed continues to be the dominant buyer of government bonds, the result is the Fed’s current bond buying program will simply be replaced by the buying of all that new Treasury debt. Thus, the “taper” effectively won’t happen and the easy money will continue to flow. Capisce?
Here’s hoping you have a great week. Now let’s turn to our weekly model update…
The Big-Picture Market Models
We start with six of our favorite long-term market models. These models are designed to help determine the “state” of the overall market.
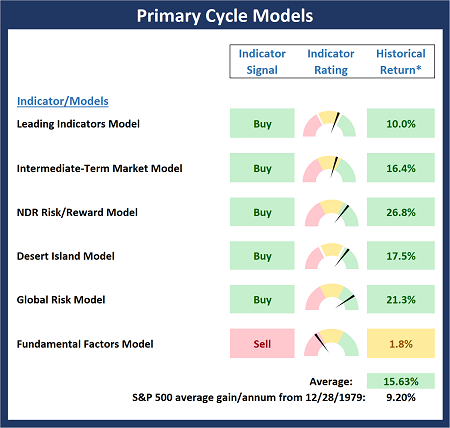
* Source: Ned Davis Research (NDR) as of the date of publication. Historical returns are hypothetical average annual performances calculated by NDR.
The Fundamental Backdrop
Next, we review the market’s fundamental factors including interest rates, the economy, earnings, inflation, and valuations.
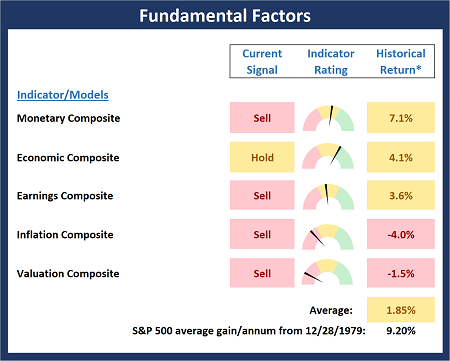
* Source: Ned Davis Research (NDR) as of the date of publication. Historical returns are hypothetical average annual performances calculated by NDR.
The State of the Trend
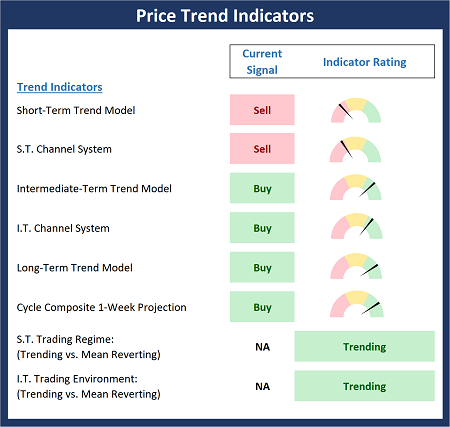
After reviewing the big-picture models and the fundamental backdrop, I like to look at the state of the current trend. This board of indicators is designed to tell us about the overall technical health of the market’s trend.
The State of Internal Momentum
Next, we analyze the momentum indicators/models to determine if there is any “oomph” behind the current move.
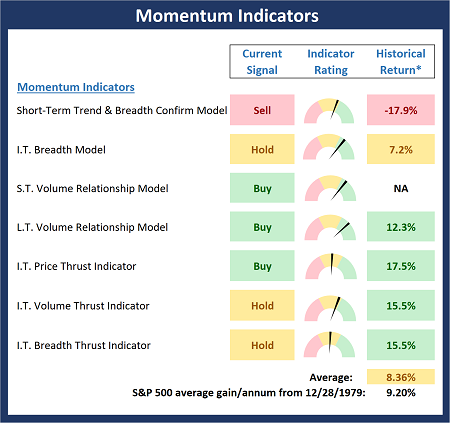
* Source: Ned Davis Research (NDR) as of the date of publication. Historical returns are hypothetical average annual performances calculated by NDR.
Early Warning Signals
Finally, we look at our early warning indicators to gauge the potential for counter-trend moves. This batch of indicators is designed to suggest when the table is set for the trend to “go the other way.”
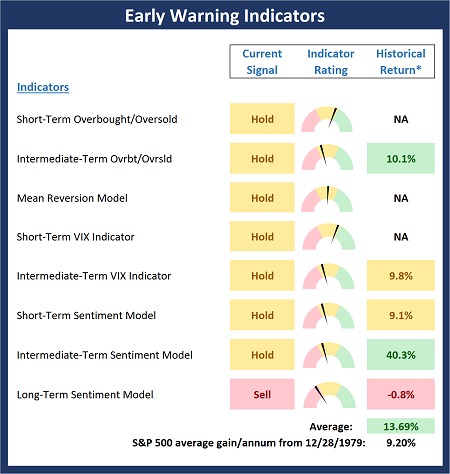
* Source: Ned Davis Research (NDR) as of the date of publication. Historical returns are hypothetical average annual performances calculated by NDR.
Thought for the Day:
Never make a promise you can’t keep. -Joe Wilson, Sr.
Market Models Explained
Wishing you green screens and all the best for a great day,

David D. Moenning
Director Institutional Consulting
Capital Advisors 360, LLC

Disclosures
At the time of publication, Mr. Moenning held long positions in the following securities mentioned:
None
– Note that positions may change at any time.
NOT INDIVIDUAL INVESTMENT ADVICE. IMPORTANT FURTHER DISCLOSURES
Tags: David Moenning, State of the Markets, Stock Market, Stocks, Stock Market Commentary, Stock Market Analysis, Investing


Institutional Consulting
David Moenning
What’s Up With Bond Yields?
I am finishing up a long weekend visit with family in Santa Fe this morning, so I’m going to keep today’s missive short and sweet. My current take is that markets remain in a consolidation mode and are now in the process of digesting/adjusting to the new info from last week’s Fed meeting, which was certainly interesting.
In case you missed it, the Fed meeting, which is now being referred to as the “talking about talking about” meeting, provided something for markets to chew on. And the resulting reaction wasn’t what one might have expected – especially in the bond arena.
The good news is Powell & Co. finally recognized that inflation is running hotter than expected and could possibly persist longer than previously thought. As such, they also admitted that they may need to start “talking about tapering” the amount of bonds the central bank is buying each month. In addition, the thinking is that the timeframe for when rate hikes could begin will be pulled forward.
And then St Louis Fed President James Bullard moved the needle a bit more on Friday by saying that he could see the first rate hikes in 2022 (and lest we forget, James Bullard is a voting member again next year). This definitely caught some folks off guard as the consensus thinking had been that there wouldn’t be any rate hikes next year.
As a result, the “reopening” stocks dove hard while the dependable earnings names fared better. This certainly makes sense as there may be some fear that the Fed may be pulling the punch bowl prematurely.
However, what doesn’t make much sense – at least from a conventional thinking standpoint – is the action in the bond market. While yields initially rose after the Fed meeting, they quickly turned around and have been sinking ever since. Don’t look now fans, but the yield on 30-year has embarked on a downtrend and the 10-year is threatening to do the same by closing Friday at the lowest level since March.
Although this may sound a bit convoluted, the idea is the bond market isn’t buying the Fed’s narrative about tapering. You see, it is important to keep in mind that US Govt is proposing to spend a LOT of money this fiscal year. For example, the Biden administration has proposed a $6 trillion budget for 2022. This will mean there will be a LOT more bonds to sold/bought.
So, since the Fed continues to be the dominant buyer of government bonds, the result is the Fed’s current bond buying program will simply be replaced by the buying of all that new Treasury debt. Thus, the “taper” effectively won’t happen and the easy money will continue to flow. Capisce?
Here’s hoping you have a great week. Now let’s turn to our weekly model update…
The Big-Picture Market Models
We start with six of our favorite long-term market models. These models are designed to help determine the “state” of the overall market.
* Source: Ned Davis Research (NDR) as of the date of publication. Historical returns are hypothetical average annual performances calculated by NDR.
The Fundamental Backdrop
Next, we review the market’s fundamental factors including interest rates, the economy, earnings, inflation, and valuations.
* Source: Ned Davis Research (NDR) as of the date of publication. Historical returns are hypothetical average annual performances calculated by NDR.
The State of the Trend
After reviewing the big-picture models and the fundamental backdrop, I like to look at the state of the current trend. This board of indicators is designed to tell us about the overall technical health of the market’s trend.
The State of Internal Momentum
Next, we analyze the momentum indicators/models to determine if there is any “oomph” behind the current move.
* Source: Ned Davis Research (NDR) as of the date of publication. Historical returns are hypothetical average annual performances calculated by NDR.
Early Warning Signals
Finally, we look at our early warning indicators to gauge the potential for counter-trend moves. This batch of indicators is designed to suggest when the table is set for the trend to “go the other way.”
* Source: Ned Davis Research (NDR) as of the date of publication. Historical returns are hypothetical average annual performances calculated by NDR.
Thought for the Day:
Never make a promise you can’t keep. -Joe Wilson, Sr.
Market Models Explained
Wishing you green screens and all the best for a great day,
David D. Moenning
Director Institutional Consulting
Capital Advisors 360, LLC
Disclosures
At the time of publication, Mr. Moenning held long positions in the following securities mentioned:
None
– Note that positions may change at any time.
NOT INDIVIDUAL INVESTMENT ADVICE. IMPORTANT FURTHER DISCLOSURES
Tags: David Moenning, State of the Markets, Stock Market, Stocks, Stock Market Commentary, Stock Market Analysis, Investing
RECENT ARTICLES
The Time Has Come
The Market Panic Playbook
Bears Get Back In The Game
Sell in May, Except…
When Being Completely Wrong Works Out
Stronger For Longer?
Archives
Archives