On Friday, we learned that inflation, as defined by the CPI, aka the Consumer Price Index (which, for the record is not the Fed’s preferred inflationary measure), rose 6.8% over the past twelve months. This was higher than expected as well as the highest reading since… wait for it… June, 1982.
Juicing the CPI number was the ongoing increase in new and used car/truck prices, which contributed 1.6% to the CPI’s year-over-year total. And if you strip out the volatile food and energy components, the so-called “core” CPI registered a 4.9% rise compared to this time last year. Not nearly as high, but still more than double the Fed’s inflation goal.
While hardly a surprise, the data supported Jay Powell’s official retirement of the word, “transitory” from the Fed’s vocabulary last week.
The thinking here is that inflation has remained elevated longer than the Fed had expected. However, I’ve been saying for much of this year that “transitory” really relates to the timeframe lens one viewed the issue.
Given the extreme supply chain issues (cue the image of all those ships backed up at various ports) and the shortages this created, I, for one, didn’t expect inflation to magically disappear in 6 months. Nor did it.
And I will admit that some of the inflation components such as certain costs as well as wages and housing prices/equivalent rents aren’t likely to fall any time soon. No, Corporate America effectively has a free pass to raise prices on just about anything right now, blaming it on inflation. Make no mistake about it; this is something that hasn’t happened in a very long time.
Then there is the situation with wages. For a myriad of reasons, companies are being forced to increase wages for their employees. This too is something that hasn’t happened in a LONG time. And also unlikely to change anytime soon.
As such, it is fairly easy to argue that a healthy dose of inflation is likely to stick around for a while. Likely a long while.
Yet at the same time, isn’t this what the Fed has been striving for since 2009? So, I don’t think we need to panic over inflation in the 2.5-3% zone.
Also, history suggests that used car prices don’t tend to rise, ever. Or, in this case, for very long. Once there are enough semiconductor chips to meet auto manufacturer demand, this situation is likely to fade, right?
And I think we can apply the same argument to almost anything that is rising due to “supply chain issues.” For me, the bottom line is that from a macro point of view, if there is more demand for a product than is currently available, somebody, somewhere will figure out a way to meet that need. Over time, of course.
This brings me to the main point here. Stocks actually rose on Friday in the face of the “worst” inflation print in a generation. Why? Because this is likely the beginning of the end for the inflation surge. Put another way, we are likely close to the peak on the inflation front. Oh, and some folks may have bought stocks and/or covered shorts due to the fact that the inflation numbers weren’t worse. It’s a thing.
Exhibit A in my thesis here is a chart from Bloomberg, which shows the annual CPI increases (the red bars) versus the consensus view of economists going forward (the blue bars).
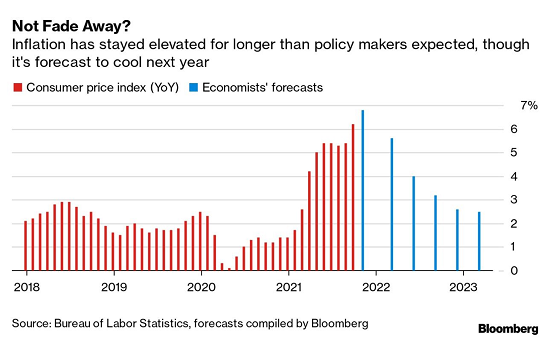
View Larger Chart
Sure, as the saying goes, weathermen were invented to make economists look good. But the point is that the projected trend of inflation for the coming year or so is down. Down to a level right about where the Fed has been targeting.
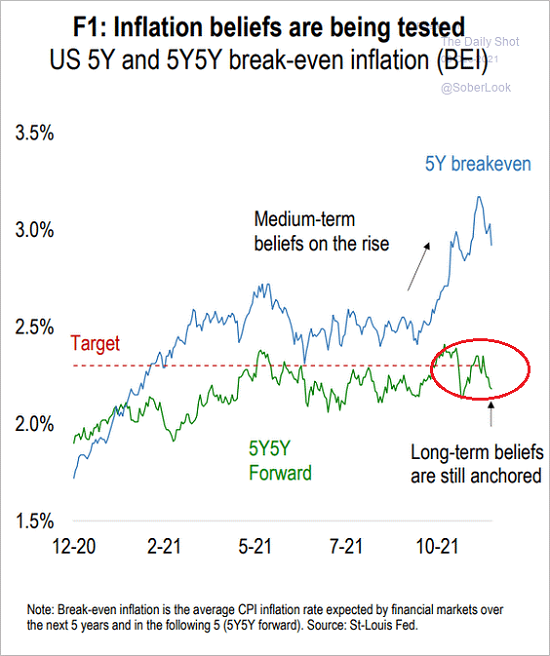
Exhibit B here is a chart of something called the “break-even inflation” expectations (the green line). I won’t bore you with the details of the chart’s makeup. But the key is that longer-term inflation expectations aren’t going up. No, they are going down. And in the same range they have been for most of the year.
Source: The Daily Shot
Thus, one can argue that Friday’s CPI report wasn’t a surprise or a “game changer” at all. It was simply in line with what markets had expected. And without a surprise, markets tend to do what they usually do, as in, look ahead. And with a Friday AP poll showing 64% of Americans describing their personal financial situation as “good,” the outlook for both the economy and earnings remains decent.
Of course, that was Friday and today is a new day. This morning, the reality of the Omicron situation (which is worse today) and the upcoming Fed meeting has traders curbing their enthusiasm – giving back those gains from Friday in the process.
Lest we forget, Jay Powell & Company are likely to announce Wednesday they will reduce their QE bond buying at a faster pace than previously discussed. Next is the idea of rate hikes coming soon after the completion of the taper. And if you will recall, this was something that Chair Powell had argued against in the not too distant past.
In fact, the latest assessment of futures (chart below) shows a 96% probability of three Fed rate hikes in 2022. Note that this was below 40% just 3 months ago.
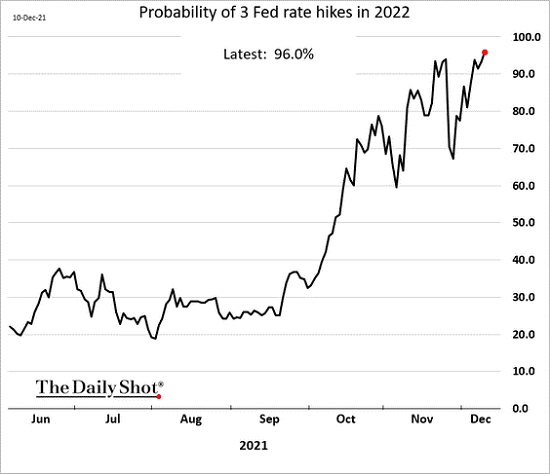
Source: The Daily Shot
So, will the market move big on the Fed news this week? Of course, anything is possible with algo-driven high-speed trading these days. But my feeling is that the market “knows” what to expect here. We shall see.
Next, let’s review the “state of the market” through the lens of our market models…
The Big-Picture Market Models
We start with six of our favorite long-term market models. These models are designed to help determine the “state” of the overall market.
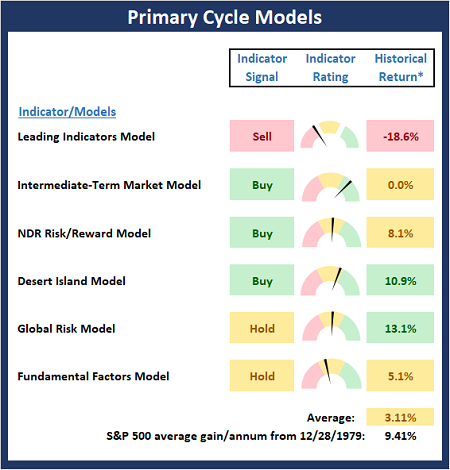
* Source: Ned Davis Research (NDR) as of the date of publication. Historical returns are hypothetical average annual performances calculated by NDR.
Current Take: Big Picture Models
There is a noticeable change to the Primary Cycle Board this week as the Leading Indicators Model flipped from green to red. However, with the rest of the board still in decent shape, I’ll continue to give the bulls the benefit of the doubt here.
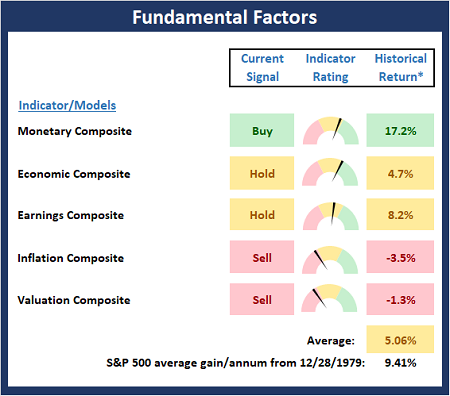
The Fundamental Backdrop
Next, we review the market’s fundamental factors including interest rates, the economy, earnings, inflation, and valuations.
* Source: Ned Davis Research (NDR) as of the date of publication. Historical returns are hypothetical average annual performances calculated by NDR.
Current Take: Fundamental Models
There are no changes to report this week on the Fundamental Board. My take on this board is that risk remains elevated from a macro perspective. Put another way, this is NOT a low-risk environment.
The State of the Trend
After reviewing the big-picture models and the fundamental backdrop, I like to look at the state of the current trend. This board of indicators is designed to tell us about the overall technical health of the market’s trend.
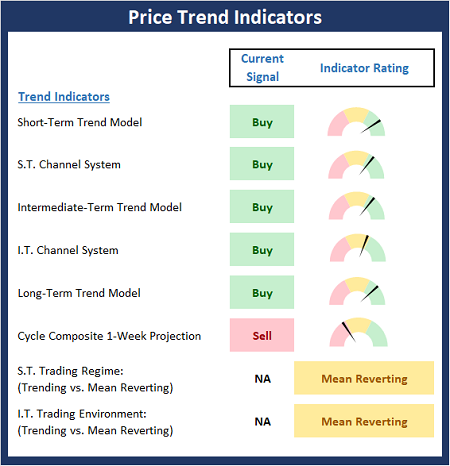
Current Take: Trend Models
Almost all is well on the Trend Board this week. The lone negative is the cycle composite reminds us that we are smack in the middle of tax-selling season.
The State of Internal Momentum
Next, we analyze the momentum indicators/models to determine if there is any “oomph” behind the current move.
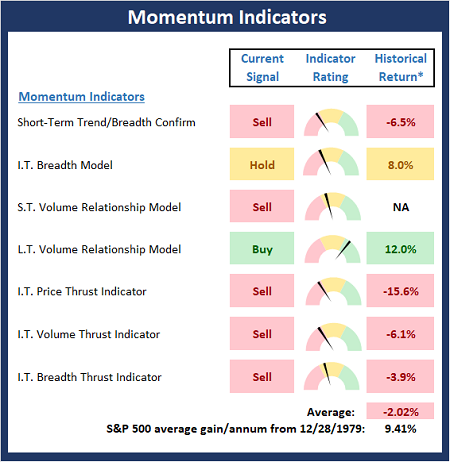
* Source: Ned Davis Research (NDR) as of the date of publication. Historical returns are hypothetical average annual performances calculated by NDR.
Current Take: Momentum Models
The bad news is the Momentum Board did not improve at all with the most recent rally. I believe this is largely due to the extent of the technical damage that occurred during the recent pullback. As such, I’d expect to see some improvement on the board next week if the bulls hope to keep the rally going.
Early Warning Indicators
Finally, we look at our early warning indicators to gauge the potential for countertrend moves. This batch of indicators is designed to suggest when the table is set for the trend to “go the other way.”
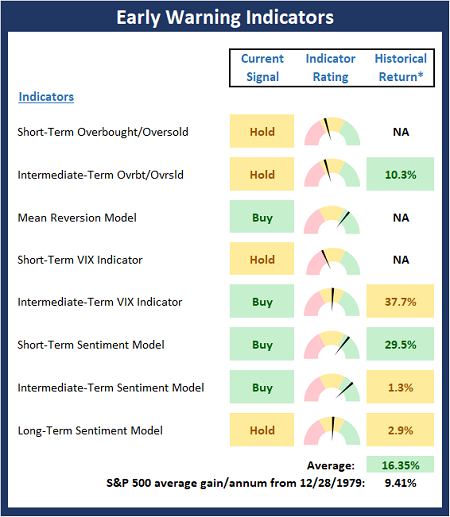
* Source: Ned Davis Research (NDR) as of the date of publication. Historical returns are hypothetical average annual performances calculated by NDR.
Current Take: Early Warning Models
Once again, the Early Warning Board did a pretty good job of indicating that the market was ready to “go the other way” for awhile. And at this stage, there are no overt warnings that the bears are ready to make another move.
Thought for the Day:
Why fit in when you were born to stand out? -Dr. Seuss
Market Models Explained
Wishing you green screens and all the best for a great day,

David D. Moenning
Director Institutional Consulting
Capital Advisors 360, LLC

Disclosures
At the time of publication, Mr. Moenning held long positions in the following securities mentioned:
None
– Note that positions may change at any time.
NOT INDIVIDUAL INVESTMENT ADVICE. IMPORTANT FURTHER DISCLOSURES
Tags: David Moenning, State of the Markets, Stock Market, Stocks, Stock Market Commentary, Stock Market Analysis, Investing


Institutional Consulting
David Moenning
Weathermen Were Invented To…
On Friday, we learned that inflation, as defined by the CPI, aka the Consumer Price Index (which, for the record is not the Fed’s preferred inflationary measure), rose 6.8% over the past twelve months. This was higher than expected as well as the highest reading since… wait for it… June, 1982.
Juicing the CPI number was the ongoing increase in new and used car/truck prices, which contributed 1.6% to the CPI’s year-over-year total. And if you strip out the volatile food and energy components, the so-called “core” CPI registered a 4.9% rise compared to this time last year. Not nearly as high, but still more than double the Fed’s inflation goal.
While hardly a surprise, the data supported Jay Powell’s official retirement of the word, “transitory” from the Fed’s vocabulary last week.
The thinking here is that inflation has remained elevated longer than the Fed had expected. However, I’ve been saying for much of this year that “transitory” really relates to the timeframe lens one viewed the issue.
Given the extreme supply chain issues (cue the image of all those ships backed up at various ports) and the shortages this created, I, for one, didn’t expect inflation to magically disappear in 6 months. Nor did it.
And I will admit that some of the inflation components such as certain costs as well as wages and housing prices/equivalent rents aren’t likely to fall any time soon. No, Corporate America effectively has a free pass to raise prices on just about anything right now, blaming it on inflation. Make no mistake about it; this is something that hasn’t happened in a very long time.
Then there is the situation with wages. For a myriad of reasons, companies are being forced to increase wages for their employees. This too is something that hasn’t happened in a LONG time. And also unlikely to change anytime soon.
As such, it is fairly easy to argue that a healthy dose of inflation is likely to stick around for a while. Likely a long while.
Yet at the same time, isn’t this what the Fed has been striving for since 2009? So, I don’t think we need to panic over inflation in the 2.5-3% zone.
Also, history suggests that used car prices don’t tend to rise, ever. Or, in this case, for very long. Once there are enough semiconductor chips to meet auto manufacturer demand, this situation is likely to fade, right?
And I think we can apply the same argument to almost anything that is rising due to “supply chain issues.” For me, the bottom line is that from a macro point of view, if there is more demand for a product than is currently available, somebody, somewhere will figure out a way to meet that need. Over time, of course.
This brings me to the main point here. Stocks actually rose on Friday in the face of the “worst” inflation print in a generation. Why? Because this is likely the beginning of the end for the inflation surge. Put another way, we are likely close to the peak on the inflation front. Oh, and some folks may have bought stocks and/or covered shorts due to the fact that the inflation numbers weren’t worse. It’s a thing.
Exhibit A in my thesis here is a chart from Bloomberg, which shows the annual CPI increases (the red bars) versus the consensus view of economists going forward (the blue bars).
View Larger Chart
Sure, as the saying goes, weathermen were invented to make economists look good. But the point is that the projected trend of inflation for the coming year or so is down. Down to a level right about where the Fed has been targeting.
Exhibit B here is a chart of something called the “break-even inflation” expectations (the green line). I won’t bore you with the details of the chart’s makeup. But the key is that longer-term inflation expectations aren’t going up. No, they are going down. And in the same range they have been for most of the year.
Source: The Daily Shot
Thus, one can argue that Friday’s CPI report wasn’t a surprise or a “game changer” at all. It was simply in line with what markets had expected. And without a surprise, markets tend to do what they usually do, as in, look ahead. And with a Friday AP poll showing 64% of Americans describing their personal financial situation as “good,” the outlook for both the economy and earnings remains decent.
Of course, that was Friday and today is a new day. This morning, the reality of the Omicron situation (which is worse today) and the upcoming Fed meeting has traders curbing their enthusiasm – giving back those gains from Friday in the process.
Lest we forget, Jay Powell & Company are likely to announce Wednesday they will reduce their QE bond buying at a faster pace than previously discussed. Next is the idea of rate hikes coming soon after the completion of the taper. And if you will recall, this was something that Chair Powell had argued against in the not too distant past.
In fact, the latest assessment of futures (chart below) shows a 96% probability of three Fed rate hikes in 2022. Note that this was below 40% just 3 months ago.
Source: The Daily Shot
So, will the market move big on the Fed news this week? Of course, anything is possible with algo-driven high-speed trading these days. But my feeling is that the market “knows” what to expect here. We shall see.
Next, let’s review the “state of the market” through the lens of our market models…
The Big-Picture Market Models
We start with six of our favorite long-term market models. These models are designed to help determine the “state” of the overall market.
* Source: Ned Davis Research (NDR) as of the date of publication. Historical returns are hypothetical average annual performances calculated by NDR.
Current Take: Big Picture Models
There is a noticeable change to the Primary Cycle Board this week as the Leading Indicators Model flipped from green to red. However, with the rest of the board still in decent shape, I’ll continue to give the bulls the benefit of the doubt here.
The Fundamental Backdrop
Next, we review the market’s fundamental factors including interest rates, the economy, earnings, inflation, and valuations.
* Source: Ned Davis Research (NDR) as of the date of publication. Historical returns are hypothetical average annual performances calculated by NDR.
Current Take: Fundamental Models
There are no changes to report this week on the Fundamental Board. My take on this board is that risk remains elevated from a macro perspective. Put another way, this is NOT a low-risk environment.
The State of the Trend
After reviewing the big-picture models and the fundamental backdrop, I like to look at the state of the current trend. This board of indicators is designed to tell us about the overall technical health of the market’s trend.
Current Take: Trend Models
Almost all is well on the Trend Board this week. The lone negative is the cycle composite reminds us that we are smack in the middle of tax-selling season.
The State of Internal Momentum
Next, we analyze the momentum indicators/models to determine if there is any “oomph” behind the current move.
* Source: Ned Davis Research (NDR) as of the date of publication. Historical returns are hypothetical average annual performances calculated by NDR.
Current Take: Momentum Models
The bad news is the Momentum Board did not improve at all with the most recent rally. I believe this is largely due to the extent of the technical damage that occurred during the recent pullback. As such, I’d expect to see some improvement on the board next week if the bulls hope to keep the rally going.
Early Warning Indicators
Finally, we look at our early warning indicators to gauge the potential for countertrend moves. This batch of indicators is designed to suggest when the table is set for the trend to “go the other way.”
* Source: Ned Davis Research (NDR) as of the date of publication. Historical returns are hypothetical average annual performances calculated by NDR.
Current Take: Early Warning Models
Once again, the Early Warning Board did a pretty good job of indicating that the market was ready to “go the other way” for awhile. And at this stage, there are no overt warnings that the bears are ready to make another move.
Thought for the Day:
Why fit in when you were born to stand out? -Dr. Seuss
Market Models Explained
Wishing you green screens and all the best for a great day,
David D. Moenning
Director Institutional Consulting
Capital Advisors 360, LLC
Disclosures
At the time of publication, Mr. Moenning held long positions in the following securities mentioned:
None
– Note that positions may change at any time.
NOT INDIVIDUAL INVESTMENT ADVICE. IMPORTANT FURTHER DISCLOSURES
Tags: David Moenning, State of the Markets, Stock Market, Stocks, Stock Market Commentary, Stock Market Analysis, Investing
RECENT ARTICLES
The Time Has Come
The Market Panic Playbook
Bears Get Back In The Game
Sell in May, Except…
When Being Completely Wrong Works Out
Stronger For Longer?
Archives
Archives