Anyone watching the action last week knows that technical breaks are happening in lots of markets. For example, my guess is you are aware that stocks broke to a new lows Friday, with the S&P 500 now back to where it stood in November 2020. And you may also be aware that the yield on the US Govt 10-Year closed the week at the highest level since 2010. But did you know commodities (using DBC as a proxy) also broke to new lows for the year last week? As did real estate (IYR). And foreign stock markets (EFA). And emerging markets (EEM), etc.
Just about everywhere you look, markets are breaking down. Primarily on the back of the idea that a global recession is not fully baked into current prices. But that’s actually not the point I’d like to make on this fine Monday morning.
No, what I’m referring to in the title of this morning’s market missive is that it appears we’ve entered the “things are starting to break” mode of this nasty bear market cycle.
More specifically, I’m talking about the UK bond market and to a lesser degree, the British pound.
Believe it or not, save the extraordinary action taken by the Bank of England (BoE) last week, experts contend the UK bond market may have collapsed. Sounds unbelievable. But apparently, it’s true.
BoE Forced to Take Action
Here’s what went down. With Jay Powell & Company hiking rates at, if memory serves, the fastest pace in history, the dollar has gone on a parabolic rise. So, with the U.S. having the highest rates around, currency traders have been moving out of just about every currency on the planet and into “King dollar.” And this has created the lowest level of the GBP versus the dollar in eons.
Then the UK’s new Prime Minister, Liz Truss, decided to channel her inner Ronald Regan and offer up a tax cut plan as one of her first official duties. In short, the announced plan didn’t go over well. Lest we forget, tax cuts tend to be inflationary and this particular plan/timing flies in the face of the inflation-fighting stance taken by something like 90% of the world’s central bankers. In addition, apparently there was no plan to “fund” the tax cuts, which would mean additional borrowing (aka bond supply) to pay for the deal.
Apparently the “bond vigilantes” decided to voice their displeasure over Truss’s plan by selling UK bonds, en masse. The selling was so intense that something called “collateral calls” for investing strategies favored by pension funds in the UK were about to occur. My understanding is the situation was about to create another wave of “forced selling” last week, which had the potential to create a negative feedback loop with dire consequences.
So, in order to stave off a crash in the “gilt” market (gilts are longer dated UK Govt bonds), the BoE had to intervene. By announcing they would buy an “unlimited amount” of UK bonds for the next month. When I read about this, my first reaction was, did they really say “unlimited?” Guess they wanted to get a point across. Wow!
What is truly amazing about this move is the BoE was expected to enter into a period of quantitative tightening (i.e., selling bonds). But in what can only be described as an shocking move, they did a complete 180 and announced “unlimited” QE for the next month. Why? To “restore market function” because, apparently without it, the market would have broken down. I’ll say it again, wow!
And THIS dear readers is what I’m talking about when I say that “things are starting to break.” If one of the biggest bond markets in the world can go to the edge on collapse, what else could go wrong here? Short answer: A lot.
The Good News
But I think there is a silver lining. Believe it or not, “stuff breaking” could be a good thing here. You see, when “stuff breaks” – as in the LTCM debacle in 1998, that money market fund breaking the buck in 2009, the European debt crises in the 2010’s, and then more recently, ETFs such as AGG “breaking” in 2020 – the Fed usually drops whatever it is doing and rides to the rescue.
And we all know how the market tends to react when the Fed cavalry mounts their white horses, right!
AS such, I was actually pretty excited when I pieced together the cause/effect of the BoE intervention. I opined that afternoon that this won’t be lost on the Fed. And since stuff was indeed starting to break, it meant that the Fed would probably have to take their foot off the gas sooner rather than later.
During a couple calls with colleagues, I further posited that this situation meant the Fed could start talking pivot. And since this is the primary “trigger” a great many analysts are waiting for to call a turn in the market, this debacle could actually be viewed as good news!
Evans Pours Cold Water
Well, until Chicago Fed President Charlie Evans opened his mouth, that is. Turns out Mr. Evans, who was ironically in London at the time, said, that the Fed needs to keep raising rates regardless of global market volatility. Ugh.
This, along with the narrative that the BoE’s intervention doesn’t fix the problems of recession, earnings, and inflation helped the bears shift into high gear and pummel stocks further into the end of the week.
Personally, I think Mr. Evans might receive a stern talking-to about the message his words conveyed last week. In essence, Evans said we don’t give a hoot about the rest of the world, we are just gonna keep hiking rates and to heck with the consequences. Frankly, I don’t think this fits with the Fed’s normally very careful messaging. So, my guess is this overly hawkish message could be walked back soon.
But in the meantime, the bears were able to shout from the rooftops about the perils of the Fed overdoing it, making a big mistake, and potentially breaking a lot more “stuff” in the near term. We shall see.
Now let’s review the “state of the market” through the lens of our market models…
The Big-Picture Market Models
We start with six of our favorite long-term market models. These models are designed to help determine the “state” of the overall market.
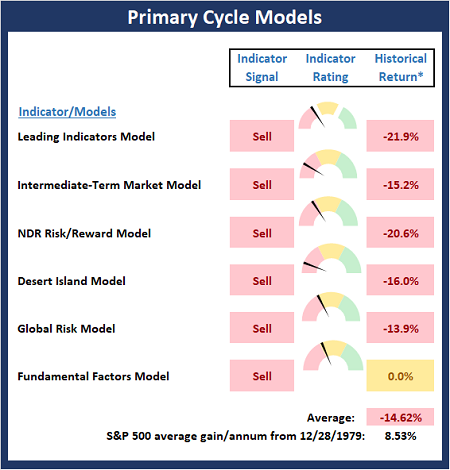
* Source: Ned Davis Research (NDR) as of the date of publication. Historical returns are hypothetical average annual performances calculated by NDR.
The Fundamental Backdrop
Next, we review the market’s fundamental factors including interest rates, the economy, earnings, inflation, and valuations.
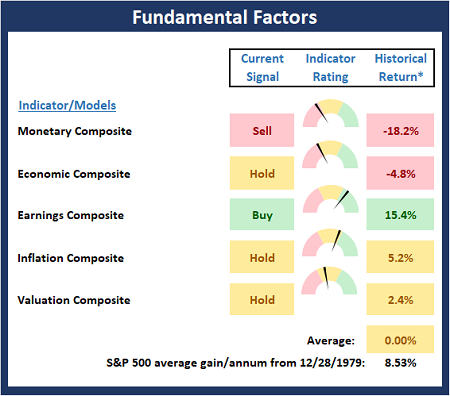
* Source: Ned Davis Research (NDR) as of the date of publication. Historical returns are hypothetical average annual performances calculated by NDR.
The State of the Trend
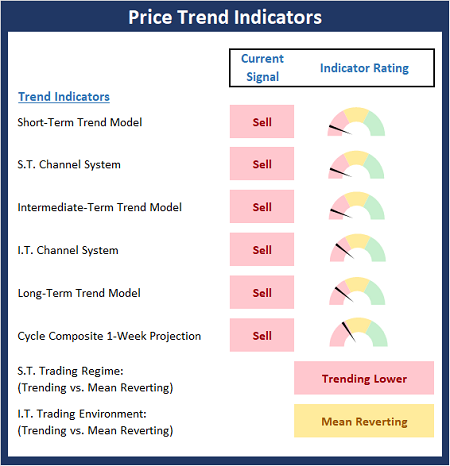
After reviewing the big-picture models and the fundamental backdrop, I like to look at the state of the current trend. This board of indicators is designed to tell us about the overall technical health of the market’s trend.
The State of Internal Momentum
Next, we analyze the momentum indicators/models to determine if there is any “oomph” behind the current move.
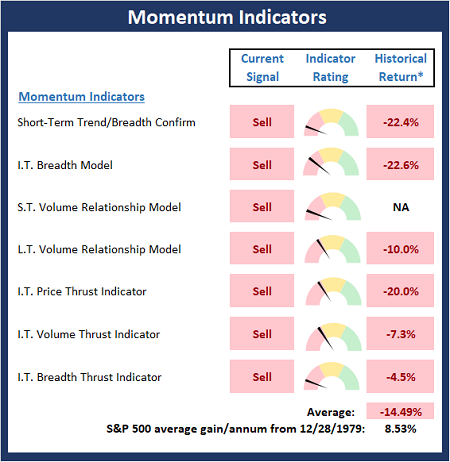
* Source: Ned Davis Research (NDR) as of the date of publication. Historical returns are hypothetical average annual performances calculated by NDR.
Early Warning Indicators
Finally, we look at our early warning indicators to gauge the potential for countertrend moves. This batch of indicators is designed to suggest when the table is set for the trend to “go the other way.”
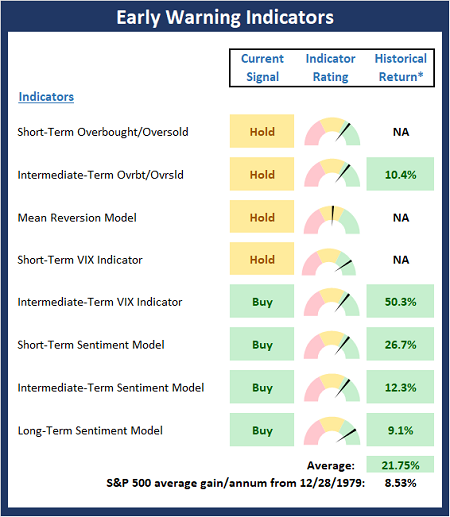
* Source: Ned Davis Research (NDR) as of the date of publication. Historical returns are hypothetical average annual performances calculated by NDR.
Thought for the Day:
Love, compassion and tolerance are necessities, not luxuries. Without them, humanity cannot survive. – Dalai Lama
Market Models Explained
Wishing you green screens and all the best for a great day,

David D. Moenning
Director Institutional Consulting
Capital Advisors 360, LLC

Disclosures
At the time of publication, Mr. Moenning held long positions in the following securities mentioned:
none
– Note that positions may change at any time.
NOT INDIVIDUAL INVESTMENT ADVICE. IMPORTANT FURTHER DISCLOSURES
Tags: David Moenning, State of the Markets, Stock Market, Stocks, Stock Market Commentary, Stock Market Analysis, Investing


Institutional Consulting
David Moenning
Things Are Starting to Break
Anyone watching the action last week knows that technical breaks are happening in lots of markets. For example, my guess is you are aware that stocks broke to a new lows Friday, with the S&P 500 now back to where it stood in November 2020. And you may also be aware that the yield on the US Govt 10-Year closed the week at the highest level since 2010. But did you know commodities (using DBC as a proxy) also broke to new lows for the year last week? As did real estate (IYR). And foreign stock markets (EFA). And emerging markets (EEM), etc.
Just about everywhere you look, markets are breaking down. Primarily on the back of the idea that a global recession is not fully baked into current prices. But that’s actually not the point I’d like to make on this fine Monday morning.
No, what I’m referring to in the title of this morning’s market missive is that it appears we’ve entered the “things are starting to break” mode of this nasty bear market cycle.
More specifically, I’m talking about the UK bond market and to a lesser degree, the British pound.
Believe it or not, save the extraordinary action taken by the Bank of England (BoE) last week, experts contend the UK bond market may have collapsed. Sounds unbelievable. But apparently, it’s true.
BoE Forced to Take Action
Here’s what went down. With Jay Powell & Company hiking rates at, if memory serves, the fastest pace in history, the dollar has gone on a parabolic rise. So, with the U.S. having the highest rates around, currency traders have been moving out of just about every currency on the planet and into “King dollar.” And this has created the lowest level of the GBP versus the dollar in eons.
Then the UK’s new Prime Minister, Liz Truss, decided to channel her inner Ronald Regan and offer up a tax cut plan as one of her first official duties. In short, the announced plan didn’t go over well. Lest we forget, tax cuts tend to be inflationary and this particular plan/timing flies in the face of the inflation-fighting stance taken by something like 90% of the world’s central bankers. In addition, apparently there was no plan to “fund” the tax cuts, which would mean additional borrowing (aka bond supply) to pay for the deal.
Apparently the “bond vigilantes” decided to voice their displeasure over Truss’s plan by selling UK bonds, en masse. The selling was so intense that something called “collateral calls” for investing strategies favored by pension funds in the UK were about to occur. My understanding is the situation was about to create another wave of “forced selling” last week, which had the potential to create a negative feedback loop with dire consequences.
So, in order to stave off a crash in the “gilt” market (gilts are longer dated UK Govt bonds), the BoE had to intervene. By announcing they would buy an “unlimited amount” of UK bonds for the next month. When I read about this, my first reaction was, did they really say “unlimited?” Guess they wanted to get a point across. Wow!
What is truly amazing about this move is the BoE was expected to enter into a period of quantitative tightening (i.e., selling bonds). But in what can only be described as an shocking move, they did a complete 180 and announced “unlimited” QE for the next month. Why? To “restore market function” because, apparently without it, the market would have broken down. I’ll say it again, wow!
And THIS dear readers is what I’m talking about when I say that “things are starting to break.” If one of the biggest bond markets in the world can go to the edge on collapse, what else could go wrong here? Short answer: A lot.
The Good News
But I think there is a silver lining. Believe it or not, “stuff breaking” could be a good thing here. You see, when “stuff breaks” – as in the LTCM debacle in 1998, that money market fund breaking the buck in 2009, the European debt crises in the 2010’s, and then more recently, ETFs such as AGG “breaking” in 2020 – the Fed usually drops whatever it is doing and rides to the rescue.
And we all know how the market tends to react when the Fed cavalry mounts their white horses, right!
AS such, I was actually pretty excited when I pieced together the cause/effect of the BoE intervention. I opined that afternoon that this won’t be lost on the Fed. And since stuff was indeed starting to break, it meant that the Fed would probably have to take their foot off the gas sooner rather than later.
During a couple calls with colleagues, I further posited that this situation meant the Fed could start talking pivot. And since this is the primary “trigger” a great many analysts are waiting for to call a turn in the market, this debacle could actually be viewed as good news!
Evans Pours Cold Water
Well, until Chicago Fed President Charlie Evans opened his mouth, that is. Turns out Mr. Evans, who was ironically in London at the time, said, that the Fed needs to keep raising rates regardless of global market volatility. Ugh.
This, along with the narrative that the BoE’s intervention doesn’t fix the problems of recession, earnings, and inflation helped the bears shift into high gear and pummel stocks further into the end of the week.
Personally, I think Mr. Evans might receive a stern talking-to about the message his words conveyed last week. In essence, Evans said we don’t give a hoot about the rest of the world, we are just gonna keep hiking rates and to heck with the consequences. Frankly, I don’t think this fits with the Fed’s normally very careful messaging. So, my guess is this overly hawkish message could be walked back soon.
But in the meantime, the bears were able to shout from the rooftops about the perils of the Fed overdoing it, making a big mistake, and potentially breaking a lot more “stuff” in the near term. We shall see.
Now let’s review the “state of the market” through the lens of our market models…
The Big-Picture Market Models
We start with six of our favorite long-term market models. These models are designed to help determine the “state” of the overall market.
* Source: Ned Davis Research (NDR) as of the date of publication. Historical returns are hypothetical average annual performances calculated by NDR.
The Fundamental Backdrop
Next, we review the market’s fundamental factors including interest rates, the economy, earnings, inflation, and valuations.
* Source: Ned Davis Research (NDR) as of the date of publication. Historical returns are hypothetical average annual performances calculated by NDR.
The State of the Trend
After reviewing the big-picture models and the fundamental backdrop, I like to look at the state of the current trend. This board of indicators is designed to tell us about the overall technical health of the market’s trend.
The State of Internal Momentum
Next, we analyze the momentum indicators/models to determine if there is any “oomph” behind the current move.
* Source: Ned Davis Research (NDR) as of the date of publication. Historical returns are hypothetical average annual performances calculated by NDR.
Early Warning Indicators
Finally, we look at our early warning indicators to gauge the potential for countertrend moves. This batch of indicators is designed to suggest when the table is set for the trend to “go the other way.”
* Source: Ned Davis Research (NDR) as of the date of publication. Historical returns are hypothetical average annual performances calculated by NDR.
Thought for the Day:
Love, compassion and tolerance are necessities, not luxuries. Without them, humanity cannot survive. – Dalai Lama
Market Models Explained
Wishing you green screens and all the best for a great day,
David D. Moenning
Director Institutional Consulting
Capital Advisors 360, LLC
Disclosures
At the time of publication, Mr. Moenning held long positions in the following securities mentioned:
none
– Note that positions may change at any time.
NOT INDIVIDUAL INVESTMENT ADVICE. IMPORTANT FURTHER DISCLOSURES
Tags: David Moenning, State of the Markets, Stock Market, Stocks, Stock Market Commentary, Stock Market Analysis, Investing
RECENT ARTICLES
The Time Has Come
The Market Panic Playbook
Bears Get Back In The Game
Sell in May, Except…
When Being Completely Wrong Works Out
Stronger For Longer?
Archives
Archives