Indicators Updated | 10.24.20
Each week we do a disciplined, deep dive into our key market indicators and models. The overall goal of this exercise is to (a) remove emotion from the investment process, (b) stay “in tune” with the primary market cycles, and (c) remain cognizant of the risk/reward environment.
The Major Market Models
We start with six of our favorite long-term market models. These models are designed to help determine the “state” of the overall market.
There are no changes to report on the Primary Cycle board this week. As I’ve opined previously, I believe the board supports the idea that stocks are currently in the midst of a cyclical bull market and suggests that the bulls should be given the benefit of any doubt.
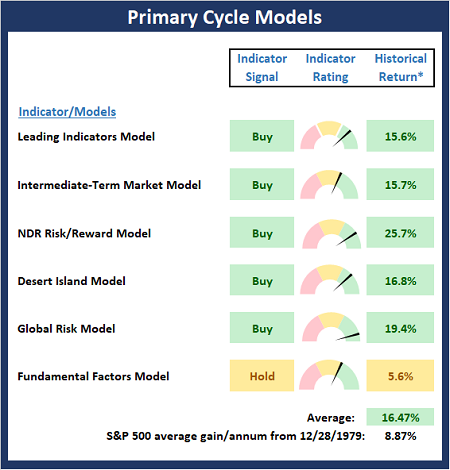
* Source: Ned Davis Research (NDR) as of the date of publication. Historical returns are hypothetical average annual performances calculated by NDR. Past performances do not guarantee future results or profitability – NOT INDIVIDUAL INVESTMENT ADVICE. For Investment Professional Use Only.
The State of the Fundamental Backdrop
Next, we review the market’s fundamental factors in the areas of interest rates, the economy, inflation, and valuations.
There are also no changes to the Fundamental Factors board to report again this week. I believe the keys to the current fundamental backdrop are (1) the stimulus/support being provided by the Treasury/Congress/Fed, (2) the strong rebound in most areas of the economy, and (3) the likeliehood for additional economic stimulus. In short, the unprecedented efforts to support the economy basically override the negative readings in a couple of our models.

* Source: Ned Davis Research (NDR) as of the date of publication. Historical returns are hypothetical average annual performances calculated by NDR. Past performances do not guarantee future results or profitability – NOT INDIVIDUAL INVESTMENT ADVICE. For Investment Professional Use Only.
Additional Valuation Metrics:
- GAAP P/E Ratio (Monthly Data) as of 9/30/20: 36.15 (last month: 35.30 two months ago: 32.73, three months ago: 31.02, four months ago: 26.03, five months ago: 24.29, six months ago: 18.81)
Average from 3/31/1926: 17.4
- NDR Valuation Model (Monthly Data):
+1 standard deviation from median): 2697 (-19.8%)
year median): 2062 (-38.7%)
Undervalued Level (-1 standard deviation from median): 1423 (-57.7%)
The State of the Trend
After looking at the big-picture models and the fundamental backdrop, I like to look at the state of the trend. This board of indicators is designed to tell us about the overall technical health of the current trend.
Despite the sloppy action in the market, the trend board up-ticked slightly again last week. However, the real key here is to recognize that all the major stock market indices remain entrenched in trading ranges.

NOT INDIVIDUAL INVESTMENT ADVICE. For Investment Professional Use Only.
Key Price Levels
- S&P 500 Near-Term Support Zone: 3420
- S&P 500 Near-Term Resistance Zone: 3600
- MA Direction: Rising S&P 500 50-day Simple MA: 3408
- S&P 500 200-day Simple MA: 3128
The State of Internal Momentum
Next, we analyze the “oomph” behind the current trend via our group of market momentum indicators/models.
The Momentum Board down-ticked modestly last week as our short-term trend-and-breadth-confirm model fell to neutral. All in, I believe the momentum board suggests that the bulls still have a slight edge here.

* Source: Ned Davis Research (NDR) as of the date of publication. Historical returns are hypothetical average annual performances calculated by NDR. Past performances do not guarantee future results or profitability – NOT INDIVIDUAL INVESTMENT ADVICE. For Investment Professional Use Only.
Early Warning Signals
Once we have identified the current environment, the state of the trend, and the degree of momentum behind the move, we then review the potential for a counter-trend move to begin. This batch of indicators is designed to suggest when the table is set for the trend to “go the other way.”
The Early Warning board also slip a bit last week. But, there continues to be no “table pounding” message from the board at this time. So, it’s basically “game on” between the teams for control of the ball.

* Source: Ned Davis Research (NDR) as of the date of publication. Historical returns are hypothetical average annual performances calculated by NDR. Past performances do not guarantee future results or profitability – NOT INDIVIDUAL INVESTMENT ADVICE. For Investment Professional Use Only.
The Capital Advisors 360 Dynamic Allocation Model
Our Dynamic Allocation Model is designed to provide a weekly update of current equity and bond allocations for an adaptive, balanced tactical asset allocation model with a base target of 60/40 stocks/bonds. The overriding intent of the model is to keep equity exposure in line with current conditions.

NOT INDIVIDUAL INVESTMENT ADVICE. For Investment Professional Use Only.
Below are the historical equity exposure readings for the Dynamic Asset Allocation Model. Note that the difference between the equity exposure reading and 100% is the allocation to fixed income.

NOT INDIVIDUAL INVESTMENT ADVICE. For Investment Professional Use Only.
Wishing you green screens and all the best for a great day,

David D. Moenning
Director of Institutional Consulting
Capital Advisors 360, LLC

*Explanations & Disclosures: Educational purposes only – not individual investment advice. Historical returns are hypothetical average annual performances calculated by NDR. Past performances do not guarantee future results or profitability. At the time of publication, Mr. Moenning held long positions in the following securities mentioned: NONE – please note that these positions may change at any time. Please click here for further important State of the Market model explanations and disclaimers.


Institutional Consulting
David Moenning
The State of the Market Models | 10.24.20
Indicators Updated | 10.24.20
Each week we do a disciplined, deep dive into our key market indicators and models. The overall goal of this exercise is to (a) remove emotion from the investment process, (b) stay “in tune” with the primary market cycles, and (c) remain cognizant of the risk/reward environment.
The Major Market Models
We start with six of our favorite long-term market models. These models are designed to help determine the “state” of the overall market.
There are no changes to report on the Primary Cycle board this week. As I’ve opined previously, I believe the board supports the idea that stocks are currently in the midst of a cyclical bull market and suggests that the bulls should be given the benefit of any doubt.
* Source: Ned Davis Research (NDR) as of the date of publication. Historical returns are hypothetical average annual performances calculated by NDR. Past performances do not guarantee future results or profitability – NOT INDIVIDUAL INVESTMENT ADVICE. For Investment Professional Use Only.
The State of the Fundamental Backdrop
Next, we review the market’s fundamental factors in the areas of interest rates, the economy, inflation, and valuations.
There are also no changes to the Fundamental Factors board to report again this week. I believe the keys to the current fundamental backdrop are (1) the stimulus/support being provided by the Treasury/Congress/Fed, (2) the strong rebound in most areas of the economy, and (3) the likeliehood for additional economic stimulus. In short, the unprecedented efforts to support the economy basically override the negative readings in a couple of our models.
* Source: Ned Davis Research (NDR) as of the date of publication. Historical returns are hypothetical average annual performances calculated by NDR. Past performances do not guarantee future results or profitability – NOT INDIVIDUAL INVESTMENT ADVICE. For Investment Professional Use Only.
Additional Valuation Metrics:
25-year Average: 26.0
50-year Average: 19.9
Average from 3/31/1926: 17.4
Overvalued Level (
+1 standard deviation from median): 2697 (-19.8%)
Fair value Level (50
year median): 2062 (-38.7%)
Undervalued Level (-1 standard deviation from median): 1423 (-57.7%)
The State of the Trend
After looking at the big-picture models and the fundamental backdrop, I like to look at the state of the trend. This board of indicators is designed to tell us about the overall technical health of the current trend.
Despite the sloppy action in the market, the trend board up-ticked slightly again last week. However, the real key here is to recognize that all the major stock market indices remain entrenched in trading ranges.
NOT INDIVIDUAL INVESTMENT ADVICE. For Investment Professional Use Only.
Key Price Levels
The State of Internal Momentum
Next, we analyze the “oomph” behind the current trend via our group of market momentum indicators/models.
The Momentum Board down-ticked modestly last week as our short-term trend-and-breadth-confirm model fell to neutral. All in, I believe the momentum board suggests that the bulls still have a slight edge here.
* Source: Ned Davis Research (NDR) as of the date of publication. Historical returns are hypothetical average annual performances calculated by NDR. Past performances do not guarantee future results or profitability – NOT INDIVIDUAL INVESTMENT ADVICE. For Investment Professional Use Only.
Early Warning Signals
Once we have identified the current environment, the state of the trend, and the degree of momentum behind the move, we then review the potential for a counter-trend move to begin. This batch of indicators is designed to suggest when the table is set for the trend to “go the other way.”
The Early Warning board also slip a bit last week. But, there continues to be no “table pounding” message from the board at this time. So, it’s basically “game on” between the teams for control of the ball.
* Source: Ned Davis Research (NDR) as of the date of publication. Historical returns are hypothetical average annual performances calculated by NDR. Past performances do not guarantee future results or profitability – NOT INDIVIDUAL INVESTMENT ADVICE. For Investment Professional Use Only.
The Capital Advisors 360 Dynamic Allocation Model
Our Dynamic Allocation Model is designed to provide a weekly update of current equity and bond allocations for an adaptive, balanced tactical asset allocation model with a base target of 60/40 stocks/bonds. The overriding intent of the model is to keep equity exposure in line with current conditions.
NOT INDIVIDUAL INVESTMENT ADVICE. For Investment Professional Use Only.
Below are the historical equity exposure readings for the Dynamic Asset Allocation Model. Note that the difference between the equity exposure reading and 100% is the allocation to fixed income.
NOT INDIVIDUAL INVESTMENT ADVICE. For Investment Professional Use Only.
Wishing you green screens and all the best for a great day,
David D. Moenning
Director of Institutional Consulting
Capital Advisors 360, LLC
*Explanations & Disclosures: Educational purposes only – not individual investment advice. Historical returns are hypothetical average annual performances calculated by NDR. Past performances do not guarantee future results or profitability. At the time of publication, Mr. Moenning held long positions in the following securities mentioned: NONE – please note that these positions may change at any time. Please click here for further important State of the Market model explanations and disclaimers.
RECENT ARTICLES
The Time Has Come
The Market Panic Playbook
Bears Get Back In The Game
Sell in May, Except…
When Being Completely Wrong Works Out
Stronger For Longer?
Archives
Archives