The State of the Market
It is said that earnings are the mother’s milk of bull markets. This certainly seems to make sense as it is easy to argue that expectations for higher earnings create an environment for rising stock prices. And don’t look now fans, but earnings expectations are rising.
Yes, it is true that there are times when stocks rise while earnings are actually falling. And I can provide statistical evidence to support the idea that the absolute best returns for the market occur when earnings are declining in earnest. The nadir of a recession is the poster child for this scenario.
Remember, the stock market is… everybody join in now… “a discounting mechanism of future expectations.” So, while earnings typically fall during a recession, stock prices eventually begin to discount better days. And this is how new bull markets are born. In short, stocks start looking ahead and thus, prices wind up rising while earnings are still falling.
But eventually, both the economy and earnings turn up and the end to a recession becomes official – in hindsight, of course! And this is why some of the best market returns occur when earnings are actually still declining.
However, once a recession or a crisis ends, the stock market game becomes all about growth. In other words, once it becomes clear that the turn has occurred, corporate earnings have to deliver. And this, dear readers, is where I believe we are right now.
Stocks have rallied hard on the hope for a return to normalcy. The strong gains in the stock market did indeed occur while lockdowns were still in place, new Covid cases were rising, and before vaccines were even approved. As I’ve said a time or two over the past half-year or so, from my seat, this was a classic case of stocks looking ahead to better days.
But… Stocks can only go so far on hope alone. At some point in time, the growth that investors have been betting on needs to show up. Otherwise, stocks will have to “correct” some of that hope and adjust for reality. Thus, my take is that where earnings go from here is mission critical for the bulls.
The good news is that earnings expectations are starting to perk up in earnest. And while this may be an oversimplification, I will opine that rising earnings just might be able to justify higher prices from here. Assuming the growth keeps coming, of course.
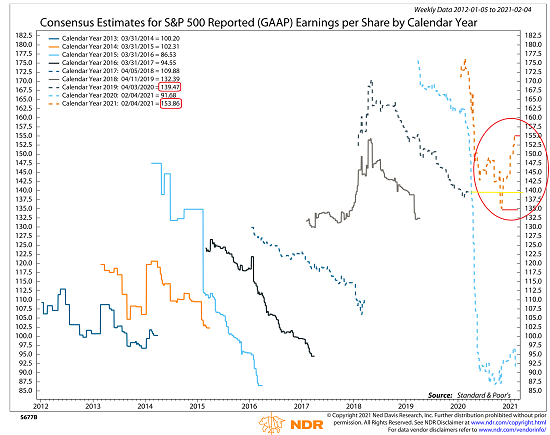
Below is a chart of GAAP EPS (Generally Accepted Accounting Principles for Earnings Per Share) expectations on the S&P 500. I’ve shown this chart on numerous occasions in the past, as I believe it is important to stay on top of which way expectations are heading.
But this time around, I’d like you to focus on what is happening inside the circle I’ve drawn in red.
The orange dashed line is the history of S&P GAAP EPS for 2021. Note that expectations fell hard as the pandemic worsened and then bottomed out near the end of the year. The low point of EPS expectations was around $135 and the current expectations are approximately $155 ($153.86 to be exact), which is a nice pop.
View Full Size Chart
* Source: Ned Davis Research
So, here’s my thinking about the near-term situation. Near the end of 2020, the expectations for EPS were approximately $135. Since then, the expectations have improved by about $19. If we then apply a 20 multiple to that, we get 380, which is the increase we could expect to see in the price of the S&P 500. Now, add 380 to the year-end closing price of 3756 and you get 4136, which is about 3.5% higher than where the S&P 500 closed on Friday (3994). As such, one could argue that stock prices are not overpriced relative to earnings expectations at this time – and that stocks may even have room to roam on the upside – again from a very near-term perspective.
Yes, I understand that there are holes in this back-of-the-napkin analysis. And yes, I also understand that based on the current EPS estimates, the S&P is trading at a very high multiple. As such, the thinking is that stocks may have already priced in a lot of the improvement that we are now starting to see.
But, if the majority of the population can get vaccinated in the next few months and Covid can be tamed, I believe that pent-up demand could easily help propel EPS estimates up and to the right on the chart. Which could, of course, become the basis for additional price gains in stocks. We shall see.
Now let’s turn to the state of my favorite big-picture market models…
The Big-Picture Market Models
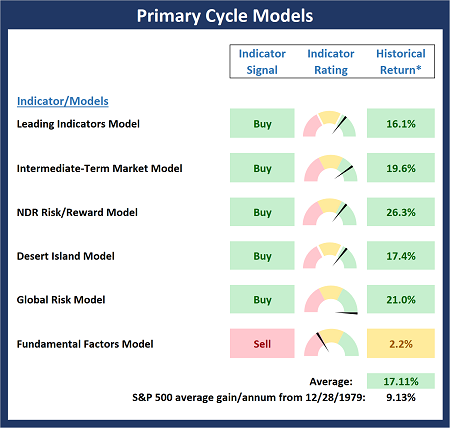
There are no obvious changes to report on the Primary Cycle board this week. As I’ve been saying for some time now, I believe the state of the Primary Cycle Models suggests that we should stay seated on the bull train.
* Source: Ned Davis Research (NDR) as of the date of publication. Historical returns are hypothetical average annual performances calculated by NDR.
Fundamental Factor Models
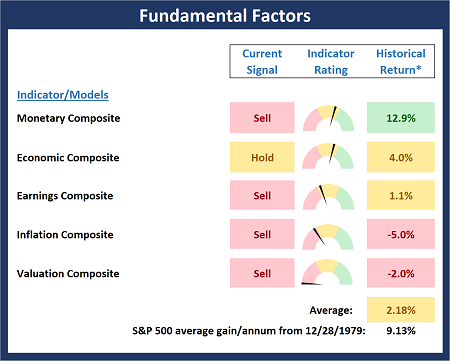
There are also no changes to the Fundamental board again this week. As I said last week, I believe the Fundamental board tells us that the risk environment is elevated. As such, it is crucial for vaccinations to continue and for earnings to continue to improve at a strong clip.
* Source: Ned Davis Research (NDR) as of the date of publication. Historical returns are hypothetical average annual performances calculated by NDR.
“Primary” Cycle History
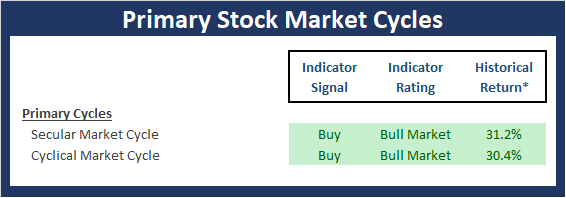
I have found that checking in on state of the cycles and the weekly/monthly charts helps to keep the big-picture in perspective.
* Source: Ned Davis Research (NDR) as of the date of publication. Historical returns are hypothetical average annual performances calculated by NDR.
The Secular Market Cycle
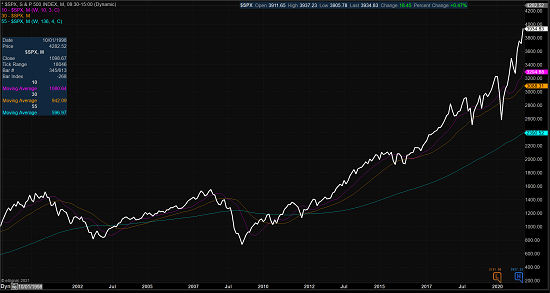
Below is a monthly chart of the S&P 500 Index illustrating the current cycle, which we estimate began on March 9, 2009.
S&P 500 – Monthly
View Full Size Chart Online
The Cyclical Market Cycle
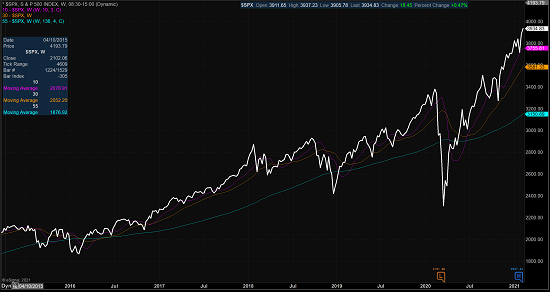
Below is a weekly chart of the S&P 500 illustrating the current cycle, which we estimate began on March 24, 2020.
S&P 500 – Weekly
View Full Size Chart Online
Thought for the Day:
Let’s make lying bad again. -Bumper Sticker
Market Models Explained
Wishing you green screens and all the best for a great day,

David D. Moenning
Director Institutional Consulting
Capital Advisors 360, LLC

Disclosures
At the time of publication, Mr. Moenning held long positions in the following securities mentioned:
none
– Note that positions may change at any time.
NOT INDIVIDUAL INVESTMENT ADVICE. IMPORTANT FURTHER DISCLOSURES
Tags: David Moenning, State of the Markets, Stock Market, Stocks, Stock Market Commentary, Stock Market Analysis, Investing


Institutional Consulting
David Moenning
The Mother’s Milk of Bull Markets
The State of the Market
It is said that earnings are the mother’s milk of bull markets. This certainly seems to make sense as it is easy to argue that expectations for higher earnings create an environment for rising stock prices. And don’t look now fans, but earnings expectations are rising.
Yes, it is true that there are times when stocks rise while earnings are actually falling. And I can provide statistical evidence to support the idea that the absolute best returns for the market occur when earnings are declining in earnest. The nadir of a recession is the poster child for this scenario.
Remember, the stock market is… everybody join in now… “a discounting mechanism of future expectations.” So, while earnings typically fall during a recession, stock prices eventually begin to discount better days. And this is how new bull markets are born. In short, stocks start looking ahead and thus, prices wind up rising while earnings are still falling.
But eventually, both the economy and earnings turn up and the end to a recession becomes official – in hindsight, of course! And this is why some of the best market returns occur when earnings are actually still declining.
However, once a recession or a crisis ends, the stock market game becomes all about growth. In other words, once it becomes clear that the turn has occurred, corporate earnings have to deliver. And this, dear readers, is where I believe we are right now.
Stocks have rallied hard on the hope for a return to normalcy. The strong gains in the stock market did indeed occur while lockdowns were still in place, new Covid cases were rising, and before vaccines were even approved. As I’ve said a time or two over the past half-year or so, from my seat, this was a classic case of stocks looking ahead to better days.
But… Stocks can only go so far on hope alone. At some point in time, the growth that investors have been betting on needs to show up. Otherwise, stocks will have to “correct” some of that hope and adjust for reality. Thus, my take is that where earnings go from here is mission critical for the bulls.
The good news is that earnings expectations are starting to perk up in earnest. And while this may be an oversimplification, I will opine that rising earnings just might be able to justify higher prices from here. Assuming the growth keeps coming, of course.
Below is a chart of GAAP EPS (Generally Accepted Accounting Principles for Earnings Per Share) expectations on the S&P 500. I’ve shown this chart on numerous occasions in the past, as I believe it is important to stay on top of which way expectations are heading.
But this time around, I’d like you to focus on what is happening inside the circle I’ve drawn in red.
The orange dashed line is the history of S&P GAAP EPS for 2021. Note that expectations fell hard as the pandemic worsened and then bottomed out near the end of the year. The low point of EPS expectations was around $135 and the current expectations are approximately $155 ($153.86 to be exact), which is a nice pop.
View Full Size Chart
* Source: Ned Davis Research
So, here’s my thinking about the near-term situation. Near the end of 2020, the expectations for EPS were approximately $135. Since then, the expectations have improved by about $19. If we then apply a 20 multiple to that, we get 380, which is the increase we could expect to see in the price of the S&P 500. Now, add 380 to the year-end closing price of 3756 and you get 4136, which is about 3.5% higher than where the S&P 500 closed on Friday (3994). As such, one could argue that stock prices are not overpriced relative to earnings expectations at this time – and that stocks may even have room to roam on the upside – again from a very near-term perspective.
Yes, I understand that there are holes in this back-of-the-napkin analysis. And yes, I also understand that based on the current EPS estimates, the S&P is trading at a very high multiple. As such, the thinking is that stocks may have already priced in a lot of the improvement that we are now starting to see.
But, if the majority of the population can get vaccinated in the next few months and Covid can be tamed, I believe that pent-up demand could easily help propel EPS estimates up and to the right on the chart. Which could, of course, become the basis for additional price gains in stocks. We shall see.
Now let’s turn to the state of my favorite big-picture market models…
The Big-Picture Market Models
There are no obvious changes to report on the Primary Cycle board this week. As I’ve been saying for some time now, I believe the state of the Primary Cycle Models suggests that we should stay seated on the bull train.
* Source: Ned Davis Research (NDR) as of the date of publication. Historical returns are hypothetical average annual performances calculated by NDR.
Fundamental Factor Models
There are also no changes to the Fundamental board again this week. As I said last week, I believe the Fundamental board tells us that the risk environment is elevated. As such, it is crucial for vaccinations to continue and for earnings to continue to improve at a strong clip.
* Source: Ned Davis Research (NDR) as of the date of publication. Historical returns are hypothetical average annual performances calculated by NDR.
“Primary” Cycle History
I have found that checking in on state of the cycles and the weekly/monthly charts helps to keep the big-picture in perspective.
* Source: Ned Davis Research (NDR) as of the date of publication. Historical returns are hypothetical average annual performances calculated by NDR.
The Secular Market Cycle
Below is a monthly chart of the S&P 500 Index illustrating the current cycle, which we estimate began on March 9, 2009.
S&P 500 – Monthly

View Full Size Chart Online
The Cyclical Market Cycle
Below is a weekly chart of the S&P 500 illustrating the current cycle, which we estimate began on March 24, 2020.
S&P 500 – Weekly

View Full Size Chart Online
Thought for the Day:
Let’s make lying bad again. -Bumper Sticker
Market Models Explained
Wishing you green screens and all the best for a great day,
David D. Moenning
Director Institutional Consulting
Capital Advisors 360, LLC
Disclosures
At the time of publication, Mr. Moenning held long positions in the following securities mentioned:
none
– Note that positions may change at any time.
NOT INDIVIDUAL INVESTMENT ADVICE. IMPORTANT FURTHER DISCLOSURES
Tags: David Moenning, State of the Markets, Stock Market, Stocks, Stock Market Commentary, Stock Market Analysis, Investing
RECENT ARTICLES
The Time Has Come
The Market Panic Playbook
Bears Get Back In The Game
Sell in May, Except…
When Being Completely Wrong Works Out
Stronger For Longer?
Archives
Archives