As the second quarter of 2021 winds to a close, the S&P 500 finds itself at all-time highs. To many, the new heights the venerable large-cap index has recently scaled is more than a little bewildering.
After all, wasn’t the stock market in the throes of a corrective phase just a week ago? Didn’t the discussion of the day center around how low the market would go? Wasn’t inflation set to rain on the market’s parade? Wasn’t the Fed about to pull a one-eighty? Weren’t sky-high valuations supposed to come home to roost? Wasn’t there a lot of talk about another housing bubble? And wasn’t all of the above supposed to negatively impact the economy and, in turn, corporate earnings?
Well, that was then, and this is now. Despite valuations remaining in the stratosphere, inflation numbers running hot, lots of new “taper talk,” and the Delta Variant spreading quickly in many parts of the world, stock market investors appear to remain optimistic about the future and are voting with their feet. Hmmm…
Granted, the S&P hasn’t exactly exploded out of the gate here. The DJIA, Russell 2000, and the Midcaps have not followed suit (yet?). And there are no new “breadth thrust” buy signals to report from the recent action. As such, many technicians remain unconvinced that a new leg in the current cyclical bull has begun.
Yet, the trend of S&P is undeniably up. And as the saying goes, the most bullish thing a market can do is make new highs. So, while it is easy to complain and my next statement clearly can be placed in the “duh” category, the bottom line is this remains a bull market until proven otherwise.
What’s interesting though is history suggests stocks should finish above where they are now in calendar year 2021.
Long-time Barron’s author and current CNBC commentator Mike Santoli, reports that history indeed sides with the bulls here. According to Santoli, citing a report from Schaeffer’s Investment Research, when the S&P 500’s total return in the first half of the year exceeds 12%, the index tends to move higher still in the second half.
In fact, since 1950, when the first half of the year is strong (up 12% or more) the second half has finished lower only four times. And the average gain for the second half has been about 7%. Not bad, not bad at all.
Yet at the same time, the cycle work I detailed on June 1 suggests a topping phase is likely to begin sometime in the next month or so and that a meaningful correction should follow. Couple this with the lack of broad participation in the current move and there is definitely enough to keep one’s enthusiasm bottled up.
But… Isn’t this what makes a market? For me, the key is that we’ve got pretty healthy argument between the bulls and the bears going right now – with both teams appearing to have a pretty solid case.
So, from my seat, the question of the day is whether the economy and corporate earnings will continue to surprise to the upside. If this is the case, then my guess is that earnings – and the bulls- will prevail.
Then again, the Delta Variant, inflation, or the Fed could easily put a crimp the bull camp’s point of view.
Thus, I believe this is a time when one MUST remain flexible. Don’t place a bet on the outcome. Don’t take a stand. And don’t dig in your heels about “being right.” Remember, this game isn’t about “being right,” it’s about “getting it right.”
It is for this reason that I don’t make predictions or market calls. No, my gameplan is to try to remain opinion agnostic and to try and stay in tune with what “is” happening in Ms. Market’s game – not what I think “should” be happening. (One lesson I’ve learned over the years is that Ms. Market definitely does not care what I think!)
So, as we embark on the second half of 2021 and the market begins to look ahead to 2022, I plan to remain focused on the earnings and the economic data. As long as earnings continue movin’ on up, it’s possible that stock prices could head higher as well. But if anything comes along to upset the apple cart, well, flexibility will likely be mission critical.
Here’s hoping you have a great week. Now let’s turn to our weekly model update…
The Big-Picture Market Models
We start with six of our favorite long-term market models. These models are designed to help determine the “state” of the overall market.
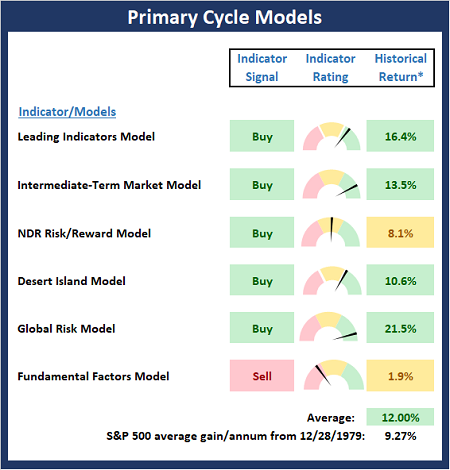
* Source: Ned Davis Research (NDR) as of the date of publication. Historical returns are hypothetical average annual performances calculated by NDR.
The Fundamental Backdrop
Next, we review the market’s fundamental factors including interest rates, the economy, earnings, inflation, and valuations.
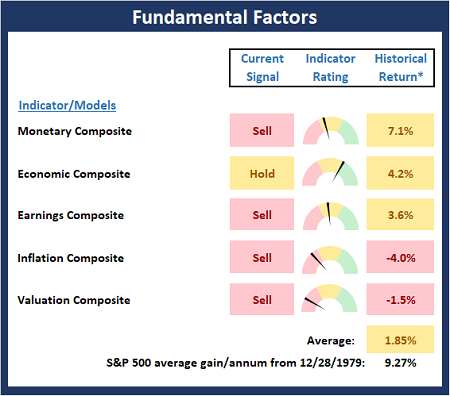
* Source: Ned Davis Research (NDR) as of the date of publication. Historical returns are hypothetical average annual performances calculated by NDR.
The State of the Trend
After reviewing the big-picture models and the fundamental backdrop, I like to look at the state of the current trend. This board of indicators is designed to tell us about the overall technical health of the market’s trend.
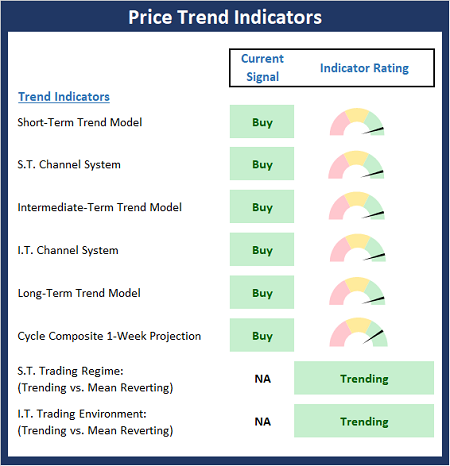
The State of Internal Momentum
Next, we analyze the momentum indicators/models to determine if there is any “oomph” behind the current move.
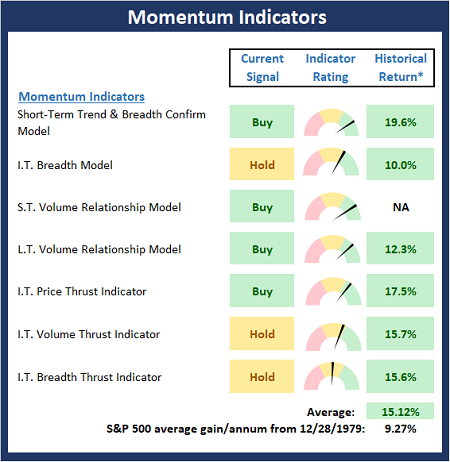
* Source: Ned Davis Research (NDR) as of the date of publication. Historical returns are hypothetical average annual performances calculated by NDR.
Early Warning Signals
Finally, we look at our early warning indicators to gauge the potential for counter-trend moves. This batch of indicators is designed to suggest when the table is set for the trend to “go the other way.”
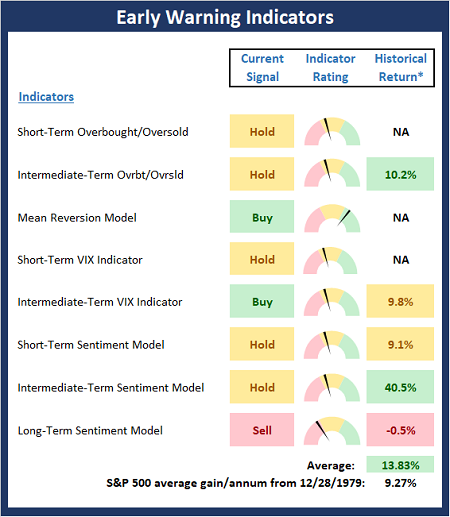
* Source: Ned Davis Research (NDR) as of the date of publication. Historical returns are hypothetical average annual performances calculated by NDR.
Thought for the Day:
Leadership is the lofting of a man’s vision to higher sights, the raising of a man’s performance to a higher standard, the building of a man’s personality beyond its normal limitations. -Peter Drucker
Market Models Explained
Wishing you green screens and all the best for a great day,

David D. Moenning
Director Institutional Consulting
Capital Advisors 360, LLC

Disclosures
At the time of publication, Mr. Moenning held long positions in the following securities mentioned:
None
– Note that positions may change at any time.
NOT INDIVIDUAL INVESTMENT ADVICE. IMPORTANT FURTHER DISCLOSURES
Tags: David Moenning, State of the Markets, Stock Market, Stocks, Stock Market Commentary, Stock Market Analysis, Investing


Institutional Consulting
David Moenning
The Key to the Second Half Will Be…
As the second quarter of 2021 winds to a close, the S&P 500 finds itself at all-time highs. To many, the new heights the venerable large-cap index has recently scaled is more than a little bewildering.
After all, wasn’t the stock market in the throes of a corrective phase just a week ago? Didn’t the discussion of the day center around how low the market would go? Wasn’t inflation set to rain on the market’s parade? Wasn’t the Fed about to pull a one-eighty? Weren’t sky-high valuations supposed to come home to roost? Wasn’t there a lot of talk about another housing bubble? And wasn’t all of the above supposed to negatively impact the economy and, in turn, corporate earnings?
Well, that was then, and this is now. Despite valuations remaining in the stratosphere, inflation numbers running hot, lots of new “taper talk,” and the Delta Variant spreading quickly in many parts of the world, stock market investors appear to remain optimistic about the future and are voting with their feet. Hmmm…
Granted, the S&P hasn’t exactly exploded out of the gate here. The DJIA, Russell 2000, and the Midcaps have not followed suit (yet?). And there are no new “breadth thrust” buy signals to report from the recent action. As such, many technicians remain unconvinced that a new leg in the current cyclical bull has begun.
Yet, the trend of S&P is undeniably up. And as the saying goes, the most bullish thing a market can do is make new highs. So, while it is easy to complain and my next statement clearly can be placed in the “duh” category, the bottom line is this remains a bull market until proven otherwise.
What’s interesting though is history suggests stocks should finish above where they are now in calendar year 2021.
Long-time Barron’s author and current CNBC commentator Mike Santoli, reports that history indeed sides with the bulls here. According to Santoli, citing a report from Schaeffer’s Investment Research, when the S&P 500’s total return in the first half of the year exceeds 12%, the index tends to move higher still in the second half.
In fact, since 1950, when the first half of the year is strong (up 12% or more) the second half has finished lower only four times. And the average gain for the second half has been about 7%. Not bad, not bad at all.
Yet at the same time, the cycle work I detailed on June 1 suggests a topping phase is likely to begin sometime in the next month or so and that a meaningful correction should follow. Couple this with the lack of broad participation in the current move and there is definitely enough to keep one’s enthusiasm bottled up.
But… Isn’t this what makes a market? For me, the key is that we’ve got pretty healthy argument between the bulls and the bears going right now – with both teams appearing to have a pretty solid case.
So, from my seat, the question of the day is whether the economy and corporate earnings will continue to surprise to the upside. If this is the case, then my guess is that earnings – and the bulls- will prevail.
Then again, the Delta Variant, inflation, or the Fed could easily put a crimp the bull camp’s point of view.
Thus, I believe this is a time when one MUST remain flexible. Don’t place a bet on the outcome. Don’t take a stand. And don’t dig in your heels about “being right.” Remember, this game isn’t about “being right,” it’s about “getting it right.”
It is for this reason that I don’t make predictions or market calls. No, my gameplan is to try to remain opinion agnostic and to try and stay in tune with what “is” happening in Ms. Market’s game – not what I think “should” be happening. (One lesson I’ve learned over the years is that Ms. Market definitely does not care what I think!)
So, as we embark on the second half of 2021 and the market begins to look ahead to 2022, I plan to remain focused on the earnings and the economic data. As long as earnings continue movin’ on up, it’s possible that stock prices could head higher as well. But if anything comes along to upset the apple cart, well, flexibility will likely be mission critical.
Here’s hoping you have a great week. Now let’s turn to our weekly model update…
The Big-Picture Market Models
We start with six of our favorite long-term market models. These models are designed to help determine the “state” of the overall market.
* Source: Ned Davis Research (NDR) as of the date of publication. Historical returns are hypothetical average annual performances calculated by NDR.
The Fundamental Backdrop
Next, we review the market’s fundamental factors including interest rates, the economy, earnings, inflation, and valuations.
* Source: Ned Davis Research (NDR) as of the date of publication. Historical returns are hypothetical average annual performances calculated by NDR.
The State of the Trend
After reviewing the big-picture models and the fundamental backdrop, I like to look at the state of the current trend. This board of indicators is designed to tell us about the overall technical health of the market’s trend.
The State of Internal Momentum
Next, we analyze the momentum indicators/models to determine if there is any “oomph” behind the current move.
* Source: Ned Davis Research (NDR) as of the date of publication. Historical returns are hypothetical average annual performances calculated by NDR.
Early Warning Signals
Finally, we look at our early warning indicators to gauge the potential for counter-trend moves. This batch of indicators is designed to suggest when the table is set for the trend to “go the other way.”
* Source: Ned Davis Research (NDR) as of the date of publication. Historical returns are hypothetical average annual performances calculated by NDR.
Thought for the Day:
Leadership is the lofting of a man’s vision to higher sights, the raising of a man’s performance to a higher standard, the building of a man’s personality beyond its normal limitations. -Peter Drucker
Market Models Explained
Wishing you green screens and all the best for a great day,
David D. Moenning
Director Institutional Consulting
Capital Advisors 360, LLC
Disclosures
At the time of publication, Mr. Moenning held long positions in the following securities mentioned:
None
– Note that positions may change at any time.
NOT INDIVIDUAL INVESTMENT ADVICE. IMPORTANT FURTHER DISCLOSURES
Tags: David Moenning, State of the Markets, Stock Market, Stocks, Stock Market Commentary, Stock Market Analysis, Investing
RECENT ARTICLES
The Time Has Come
The Market Panic Playbook
Bears Get Back In The Game
Sell in May, Except…
When Being Completely Wrong Works Out
Stronger For Longer?
Archives
Archives