As I have mentioned a time or two hundred over the years, I believe the stock market is… everybody join in now… “a discounting mechanism of future expectations.” So, with the S&P 500 closing down for a sixth consecutive week – something that hasn’t happened since the not-so fun year 2011 – it is safe to say that traders have been busy pricing in some dark days ahead.
The Economy Is Just Fine
In short, with the S&P 500 having flirted with the bear market zone last week, it is easy to argue that the market is preparing for/pricing-in a recession in the good ol’ USofA.
Wait, what? Last I heard, the economy, Corporate America, and Mr. & Mrs. John Q. Public were all doing just fine, thank you. Okay, sure, the preliminary GDP reading for Q1 2022 did come in negative. However, it looks as if there was some quirkiness in the numbers relative to trade. Oh, and then there’s the rate of change that the economy had been enjoying last year, which, as we’ve discussed on many occasions, was unsustainable. So, while the print was negative, it doesn’t mean the economy has suddenly become a dumpster fire.
Earnings Are Just Fine
And don’t look now fans, but according to FactSet, earnings are continuing to exceed expectations. For example, of the 91% of S&P companies that have reported results so far this quarter, 77% have beaten earnings estimates (which is in line with the 5-year average) and 74% have exceeded consensus sales expectations (which is above the 5-year average of 69%). And word is that profit margins remain near record highs. All in all, not too shabby, right?
In looking at the big-picture here, I think perhaps the best phrase to describe what is happening in the economy would be, “slower, but not slow.” Yes, things have cooled down a bit from the recent breakneck pace. And there are a growing number of arguments supporting the idea that economic risks are on the rise such as the Fed’s war on inflation, supply chain problems, the actual war, the huge spike in rates, ongoing COVID lockdowns, etc.
An Old-Fashioned Bear?
But does such a slowdown really warrant what is starting to feel like an old fashioned Bear Market? After all, I heard reports this week that 60% of the S&P 500 constituents are down 20% or more from their highs. And if memory serves, that same report said that 70% of the companies in the NASDAQ are in what the press likes to call “bear market territory” (meaning down 20%).
Yet, the bottom line is that at the present time, there appears to be very little risk of recession – at least according to the models I follow. For example, the good folks at Ned Davis Research have something called a Recession Watch Report, which is designed to indicate the likelihood of recession at any given time. Frankly, I don’t look at this report very often. But since everybody and their brother seems to be fretting mightily about the potential for the economy to plunge into recession, I thought I’d best take a peek.
Recession? What Recession?
The Recession Watch report contains ten models/indicators that have proven to be (a) strong and (b) early indications of recession in the United States. Indicators such as Housing Starts, Leading Indicators, an Economic Timing Model, a Recession Probability model, National Financial Conditions Index, Unemployment Claims, Consumer Confidence, CEO Confidence, and both ISM Manufacturing and Non-Manufacturing Indices. It’s really strong work.
With the market in such a tizzy, I figured there might be as many as six indicators in this report flashing red right now – which would be an indication that a recession might be/could be on the horizon.
But after studying the report over the weekend, I found there are exactly… wait for it… ZERO negative indicators. That’s right. Zero. None. Nada. Zilch!
What Gives?
So, what gives? Earnings are strong. The Fed says the economy is in good shape and can handle their front-loaded rate hikes. And there aren’t any recession warning lights flashing from our models. So, the natural question becomes, why are the indices going down to the degree they are?
All About Fear
From my seat, the answer can be summed up in one word: Fear. As in the fear of what might happen next. Fear the Fed will go too far. Fear that inflation won’t recede. Fear that another credit crunch will develop (something there are no signs of at this time). Fear of tactical nukes. Fear of WWIII. And fear that economic growth will come to a screeching halt. Ugh.
In short, it can be argued that the stock market has lost touch with reality. But who are we to judge? Remember, markets are never wrong, people are. And in this game, one has to play the cards that are dealt, not the ones they prefer.
Valuations Matter
To be fair, I certainly recognize that valuation adjustments/resets are clearly in play here. The “spectech” areas most certainly had become uber-frothy and needed a reality check. And it is clear that the valuations of the much-loved megacaps that dominated the top holdings of virtually every growth fund/ETF/Hedge Fund had become stretched relative to norms.
On the subject of valuations, I learned a long time ago that in terms of timing, “valuations don’t matter until they do – and then they matter a lot.” And it appears that this is where we are now.
What’s Next?
So, from a macro point of view, we’ve got a fearful environment on our hands. An environment that isn’t likely to change until (a) we get some signs that the major issues are starting to recede (think inflation pulling back, the Fed becoming less hawkish, and/or Putin backing off) or (b) the market has sufficiently “dealt with” the problems (think valuations improving enough for long-term investors to get off the sidelines).
Until then, my take is the best-case scenario for the near-term is that a tug-of-war develops between the bulls and the bears. I.E. A trading range or base building phase. I don’t know about you, but I’d definitely take a little back and forth over the one-way street the market has been on lately.
Now let’s review the “state of the market” through the lens of our market models…
The Big-Picture Market Models
We start with six of our favorite long-term market models. These models are designed to help determine the “state” of the overall market.
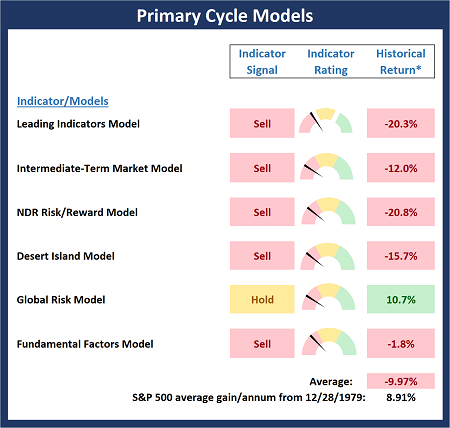
* Source: Ned Davis Research (NDR) as of the date of publication. Historical returns are hypothetical average annual performances calculated by NDR.
The Fundamental Backdrop
Next, we review the market’s fundamental factors including interest rates, the economy, earnings, inflation, and valuations.
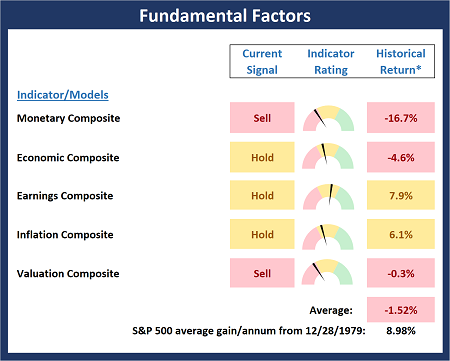
* Source: Ned Davis Research (NDR) as of the date of publication. Historical returns are hypothetical average annual performances calculated by NDR.
The State of the Trend
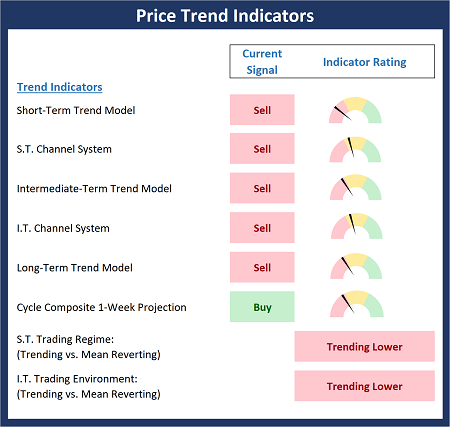
After reviewing the big-picture models and the fundamental backdrop, I like to look at the state of the current trend. This board of indicators is designed to tell us about the overall technical health of the market’s trend.
The State of Internal Momentum
Next, we analyze the momentum indicators/models to determine if there is any “oomph” behind the current move.
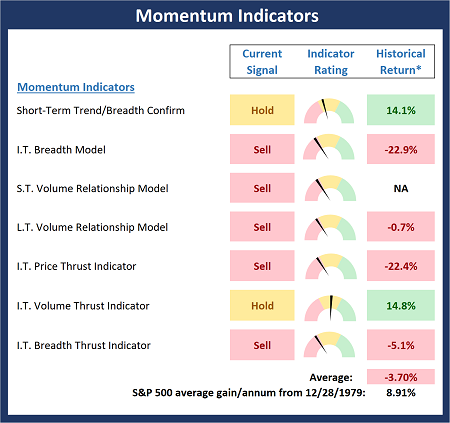
* Source: Ned Davis Research (NDR) as of the date of publication. Historical returns are hypothetical average annual performances calculated by NDR.
Early Warning Indicators
Finally, we look at our early warning indicators to gauge the potential for countertrend moves. This batch of indicators is designed to suggest when the table is set for the trend to “go the other way.”
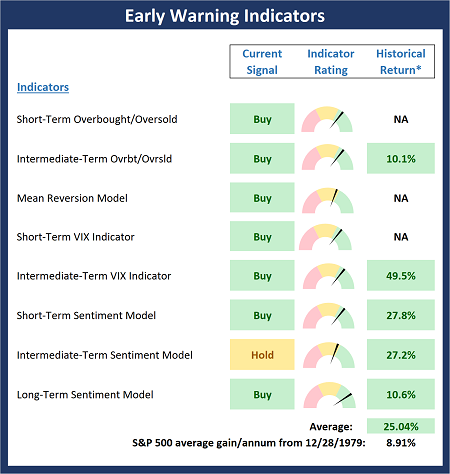
* Source: Ned Davis Research (NDR) as of the date of publication. Historical returns are hypothetical average annual performances calculated by NDR.
Thought for the Day:
You cannot prevent the birds of sorrow from flying over your head, but you can prevent them from building nests in your hair -Chinese Proverb
Market Models Explained
Wishing you green screens and all the best for a great day,

David D. Moenning
Director Institutional Consulting
Capital Advisors 360, LLC

Disclosures
At the time of publication, Mr. Moenning held long positions in the following securities mentioned:
None
– Note that positions may change at any time.
NOT INDIVIDUAL INVESTMENT ADVICE. IMPORTANT FURTHER DISCLOSURES
Tags: David Moenning, State of the Markets, Stock Market, Stocks, Stock Market Commentary, Stock Market Analysis, Investing


Institutional Consulting
David Moenning
Stocks Out of Touch With Reality?
As I have mentioned a time or two hundred over the years, I believe the stock market is… everybody join in now… “a discounting mechanism of future expectations.” So, with the S&P 500 closing down for a sixth consecutive week – something that hasn’t happened since the not-so fun year 2011 – it is safe to say that traders have been busy pricing in some dark days ahead.
The Economy Is Just Fine
In short, with the S&P 500 having flirted with the bear market zone last week, it is easy to argue that the market is preparing for/pricing-in a recession in the good ol’ USofA.
Wait, what? Last I heard, the economy, Corporate America, and Mr. & Mrs. John Q. Public were all doing just fine, thank you. Okay, sure, the preliminary GDP reading for Q1 2022 did come in negative. However, it looks as if there was some quirkiness in the numbers relative to trade. Oh, and then there’s the rate of change that the economy had been enjoying last year, which, as we’ve discussed on many occasions, was unsustainable. So, while the print was negative, it doesn’t mean the economy has suddenly become a dumpster fire.
Earnings Are Just Fine
And don’t look now fans, but according to FactSet, earnings are continuing to exceed expectations. For example, of the 91% of S&P companies that have reported results so far this quarter, 77% have beaten earnings estimates (which is in line with the 5-year average) and 74% have exceeded consensus sales expectations (which is above the 5-year average of 69%). And word is that profit margins remain near record highs. All in all, not too shabby, right?
In looking at the big-picture here, I think perhaps the best phrase to describe what is happening in the economy would be, “slower, but not slow.” Yes, things have cooled down a bit from the recent breakneck pace. And there are a growing number of arguments supporting the idea that economic risks are on the rise such as the Fed’s war on inflation, supply chain problems, the actual war, the huge spike in rates, ongoing COVID lockdowns, etc.
An Old-Fashioned Bear?
But does such a slowdown really warrant what is starting to feel like an old fashioned Bear Market? After all, I heard reports this week that 60% of the S&P 500 constituents are down 20% or more from their highs. And if memory serves, that same report said that 70% of the companies in the NASDAQ are in what the press likes to call “bear market territory” (meaning down 20%).
Yet, the bottom line is that at the present time, there appears to be very little risk of recession – at least according to the models I follow. For example, the good folks at Ned Davis Research have something called a Recession Watch Report, which is designed to indicate the likelihood of recession at any given time. Frankly, I don’t look at this report very often. But since everybody and their brother seems to be fretting mightily about the potential for the economy to plunge into recession, I thought I’d best take a peek.
Recession? What Recession?
The Recession Watch report contains ten models/indicators that have proven to be (a) strong and (b) early indications of recession in the United States. Indicators such as Housing Starts, Leading Indicators, an Economic Timing Model, a Recession Probability model, National Financial Conditions Index, Unemployment Claims, Consumer Confidence, CEO Confidence, and both ISM Manufacturing and Non-Manufacturing Indices. It’s really strong work.
With the market in such a tizzy, I figured there might be as many as six indicators in this report flashing red right now – which would be an indication that a recession might be/could be on the horizon.
But after studying the report over the weekend, I found there are exactly… wait for it… ZERO negative indicators. That’s right. Zero. None. Nada. Zilch!
What Gives?
So, what gives? Earnings are strong. The Fed says the economy is in good shape and can handle their front-loaded rate hikes. And there aren’t any recession warning lights flashing from our models. So, the natural question becomes, why are the indices going down to the degree they are?
All About Fear
From my seat, the answer can be summed up in one word: Fear. As in the fear of what might happen next. Fear the Fed will go too far. Fear that inflation won’t recede. Fear that another credit crunch will develop (something there are no signs of at this time). Fear of tactical nukes. Fear of WWIII. And fear that economic growth will come to a screeching halt. Ugh.
In short, it can be argued that the stock market has lost touch with reality. But who are we to judge? Remember, markets are never wrong, people are. And in this game, one has to play the cards that are dealt, not the ones they prefer.
Valuations Matter
To be fair, I certainly recognize that valuation adjustments/resets are clearly in play here. The “spectech” areas most certainly had become uber-frothy and needed a reality check. And it is clear that the valuations of the much-loved megacaps that dominated the top holdings of virtually every growth fund/ETF/Hedge Fund had become stretched relative to norms.
On the subject of valuations, I learned a long time ago that in terms of timing, “valuations don’t matter until they do – and then they matter a lot.” And it appears that this is where we are now.
What’s Next?
So, from a macro point of view, we’ve got a fearful environment on our hands. An environment that isn’t likely to change until (a) we get some signs that the major issues are starting to recede (think inflation pulling back, the Fed becoming less hawkish, and/or Putin backing off) or (b) the market has sufficiently “dealt with” the problems (think valuations improving enough for long-term investors to get off the sidelines).
Until then, my take is the best-case scenario for the near-term is that a tug-of-war develops between the bulls and the bears. I.E. A trading range or base building phase. I don’t know about you, but I’d definitely take a little back and forth over the one-way street the market has been on lately.
Now let’s review the “state of the market” through the lens of our market models…
The Big-Picture Market Models
We start with six of our favorite long-term market models. These models are designed to help determine the “state” of the overall market.
* Source: Ned Davis Research (NDR) as of the date of publication. Historical returns are hypothetical average annual performances calculated by NDR.
The Fundamental Backdrop
Next, we review the market’s fundamental factors including interest rates, the economy, earnings, inflation, and valuations.
* Source: Ned Davis Research (NDR) as of the date of publication. Historical returns are hypothetical average annual performances calculated by NDR.
The State of the Trend
After reviewing the big-picture models and the fundamental backdrop, I like to look at the state of the current trend. This board of indicators is designed to tell us about the overall technical health of the market’s trend.
The State of Internal Momentum
Next, we analyze the momentum indicators/models to determine if there is any “oomph” behind the current move.
* Source: Ned Davis Research (NDR) as of the date of publication. Historical returns are hypothetical average annual performances calculated by NDR.
Early Warning Indicators
Finally, we look at our early warning indicators to gauge the potential for countertrend moves. This batch of indicators is designed to suggest when the table is set for the trend to “go the other way.”
* Source: Ned Davis Research (NDR) as of the date of publication. Historical returns are hypothetical average annual performances calculated by NDR.
Thought for the Day:
You cannot prevent the birds of sorrow from flying over your head, but you can prevent them from building nests in your hair -Chinese Proverb
Market Models Explained
Wishing you green screens and all the best for a great day,
David D. Moenning
Director Institutional Consulting
Capital Advisors 360, LLC
Disclosures
At the time of publication, Mr. Moenning held long positions in the following securities mentioned:
None
– Note that positions may change at any time.
NOT INDIVIDUAL INVESTMENT ADVICE. IMPORTANT FURTHER DISCLOSURES
Tags: David Moenning, State of the Markets, Stock Market, Stocks, Stock Market Commentary, Stock Market Analysis, Investing
RECENT ARTICLES
The Time Has Come
The Market Panic Playbook
Bears Get Back In The Game
Sell in May, Except…
When Being Completely Wrong Works Out
Stronger For Longer?
Archives
Archives