This year’s drubbing in the stock and bond markets have left investors wondering, when will it end? The consensus among analysts on the subject is that the bear ought to go into hibernation once the market has “visibility” on a number of issues including, the Fed’s terminal point, peak inflation, supply chain problems, and, of course economic/earnings growth.
To be sure, Ms. Market doesn’t need all of these issues to be resolved, she just needs to know (a) that we’ve seen the worst and (b) what to expect going forward. Our heroes in horns are quick to point out that gaining clarity on where the Fed will stop hiking rates is the top priority at this juncture.
For example, it was a rather obscure data point on consumers’ inflation expectations, which is nothing more than a survey of individuals, that triggered Friday’s big bounce in stocks. In short, the 5-year inflation expectations component of the University of Michigan’s Consumer Sentiment report pulled back to 3.1% from a preliminary reading of 3.3%.
No, this was not a new CPI reading. Or even new inputs from the PPI. And the actual inflation data the Fed follows (Core PCE) were not updated. However, the very hint that consumers (and remember, this is a survey of individual consumers, not economists or Wall Street analysts) expect inflation to wane in the future was enough for shorts to run cover and the bulls to enjoy the day.
The key to this story – at least from my seat – is the narrative on future expectations could possibly be changing – or at the very least, be on the verge of changing. Gone is the idea that the economy will be just fine, thank you, and that inflation will run rampant. The bears have argued that such a combination will cause the Fed to overshoot, creating a crash landing for the economy in the process. No, in its place is the idea that a recession is coming. And like water tossed onto a raging fire, the economic slowdown is expected to put out (or at least dramatically slow) the recent surge in inflation.
Don’t get me wrong, I am NOT suggesting that Friday’s teeny tiny bit of data buried within a consumer survey means the bear market is over – or even that we’ve seen the bottom. However, what I am saying is that the path out of this market mess is beginning to come into focus.
To reiterate, the key to the bottom for this market is for investors to gain clarity on when the Fed will take a break. And hopefully sooner rather than later. This is important because it would mean Jay Powell & Company aren’t likely to wreck the economy in their quest to reduce inflation. And Friday’s report contained the very first data point that just might give the FOMC a reason to pause after another big hike or two.
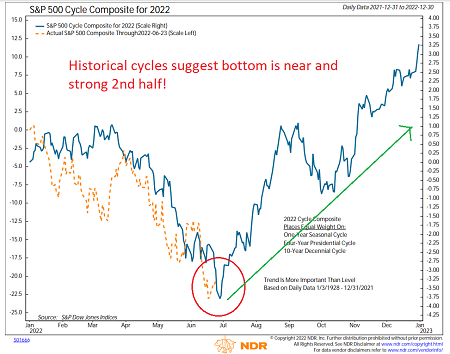
For those looking for other hopeful signs, I’ve got something that might brighten your day on this fine Monday morning. Below is the latest update to the Cycle Composite put together by Ned Davis Research Group.
To review, the Cycle Composite takes three historical cycles (the one year seasonal, the 4-year Presidential, and the 10-year decennial cycles) and mashes them together. The computer then spits out a projection of what the year might look like – in advance.
As I’ve mentioned a time or twenty over the years, Wall Street loves their historical analogs. As such, the Cycle Composite oftentimes winds up being a pretty good guide as to what to expect from the stock market in the months ahead.
Granted, there are times when the market is completely out of sync with the Cycle Composite and goes on its merry way without an iota of consideration for historical cycles. But then there are other times when this thing is very good, as in “scary good.” Like now, for instance.
NDR Cycle Composite 2022
View Chart Online
Image Source: Ned Davis Research Group
When the Cycle Composite was updated for 2022 in early January, I figured that the cycles might be off – maybe even way off this year. After all, the market had just hit all-time highs and things were looking up. Silly me.
As you can plainly see, the stock market has been largely following the Cycle Composite’s projections this year. And it is worth noting that the S&P 500 is within a hair of where the Cycle Composite suggested it would be at mid-year. Interesting!
The good news is history suggests that the bottom may be very close at hand. And that from there, stocks will move higher in a stair-step fashion in the second half of the year. I don’t know about you, but I’d take it!
So, will history continue to be a guide for the rest of 2022? Or is this one of those times when the Cycle Composite goes off the rails? Only time will tell, of course. However, during times like these, I think it is important to remember that bear markets DO end at some point (usually within about a year of beginning) and in turn, the next strong investing opportunity will be born – at some point.
Lest we forget, according to the computers at Ned Davis Research Group, the average bull market produces gains of 85.9% and Cyclical Bull Markets that occur within an ongoing Secular Bull Cycle (the assumed case for what we are experiencing now) see mean returns of more than 105%. Something to look forward to, right!
No, I don’t know when the turn will occur – when the bear will morph into a new bull. But I have been investing other people’s money for a living for more than 35 years now, and one thing I’ve learned is that markets based on the fear of what might happen tend to pass more quickly and that one must be ready for the next opportunity!
So, while I have been putting some money to work into the depths of this bear and I still have a fair amount of dry powder in the discretionary accounts I manage, I am starting to get interested in putting more cash back to work. Not all at once, mind you. No, you have to be prudent and try to use price action to your advantage. But the bottom line is I am looking forward to the next phase.
Here’s hoping the market remains in sync with Cycle Composite projections for the rest of the year.
Now let’s review the “state of the market” through the lens of our market models…
The Big-Picture Market Models
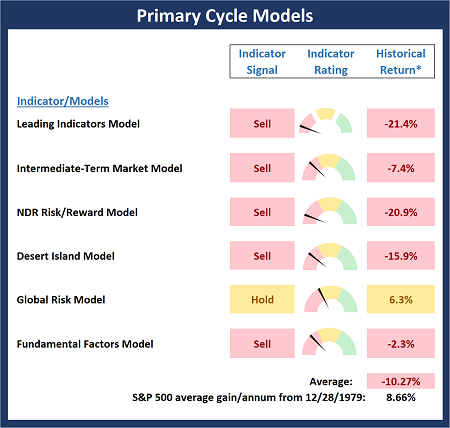
We start with six of our favorite long-term market models. These models are designed to help determine the “state” of the overall market.
* Source: Ned Davis Research (NDR) as of the date of publication. Historical returns are hypothetical average annual performances calculated by NDR.
The Fundamental Backdrop
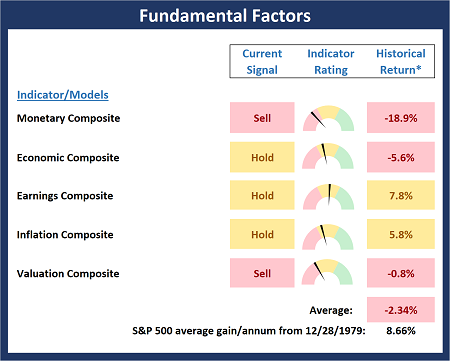
Next, we review the market’s fundamental factors including interest rates, the economy, earnings, inflation, and valuations.
* Source: Ned Davis Research (NDR) as of the date of publication. Historical returns are hypothetical average annual performances calculated by NDR.
The State of the Trend
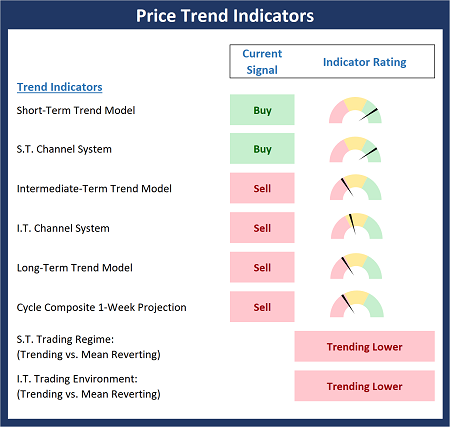
After reviewing the big-picture models and the fundamental backdrop, I like to look at the state of the current trend. This board of indicators is designed to tell us about the overall technical health of the market’s trend.
The State of Internal Momentum
Next, we analyze the momentum indicators/models to determine if there is any “oomph” behind the current move.
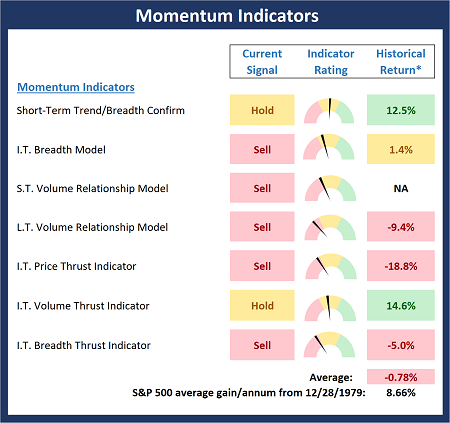
* Source: Ned Davis Research (NDR) as of the date of publication. Historical returns are hypothetical average annual performances calculated by NDR.
Early Warning Indicators
Finally, we look at our early warning indicators to gauge the potential for countertrend moves. This batch of indicators is designed to suggest when the table is set for the trend to “go the other way.”
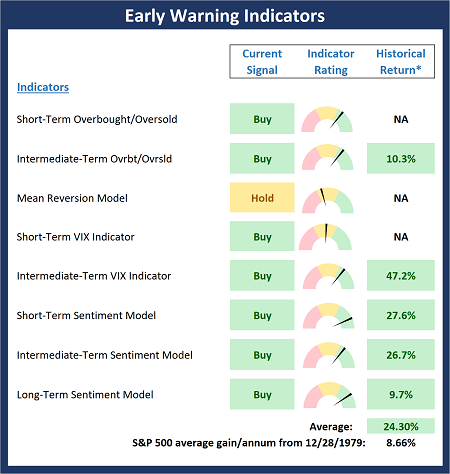
* Source: Ned Davis Research (NDR) as of the date of publication. Historical returns are hypothetical average annual performances calculated by NDR.
Thought for the Day:
Of all the hazards, fear is the worst. -Sam Snead
Market Models Explained
Wishing you green screens and all the best for a great day,

David D. Moenning
Director Institutional Consulting
Capital Advisors 360, LLC

Disclosures
At the time of publication, Mr. Moenning held long positions in the following securities mentioned:
None
– Note that positions may change at any time.
NOT INDIVIDUAL INVESTMENT ADVICE. IMPORTANT FURTHER DISCLOSURES
Tags: David Moenning, State of the Markets, Stock Market, Stocks, Stock Market Commentary, Stock Market Analysis, Investing


Institutional Consulting
David Moenning
Some Good News To Consider
This year’s drubbing in the stock and bond markets have left investors wondering, when will it end? The consensus among analysts on the subject is that the bear ought to go into hibernation once the market has “visibility” on a number of issues including, the Fed’s terminal point, peak inflation, supply chain problems, and, of course economic/earnings growth.
To be sure, Ms. Market doesn’t need all of these issues to be resolved, she just needs to know (a) that we’ve seen the worst and (b) what to expect going forward. Our heroes in horns are quick to point out that gaining clarity on where the Fed will stop hiking rates is the top priority at this juncture.
For example, it was a rather obscure data point on consumers’ inflation expectations, which is nothing more than a survey of individuals, that triggered Friday’s big bounce in stocks. In short, the 5-year inflation expectations component of the University of Michigan’s Consumer Sentiment report pulled back to 3.1% from a preliminary reading of 3.3%.
No, this was not a new CPI reading. Or even new inputs from the PPI. And the actual inflation data the Fed follows (Core PCE) were not updated. However, the very hint that consumers (and remember, this is a survey of individual consumers, not economists or Wall Street analysts) expect inflation to wane in the future was enough for shorts to run cover and the bulls to enjoy the day.
The key to this story – at least from my seat – is the narrative on future expectations could possibly be changing – or at the very least, be on the verge of changing. Gone is the idea that the economy will be just fine, thank you, and that inflation will run rampant. The bears have argued that such a combination will cause the Fed to overshoot, creating a crash landing for the economy in the process. No, in its place is the idea that a recession is coming. And like water tossed onto a raging fire, the economic slowdown is expected to put out (or at least dramatically slow) the recent surge in inflation.
Don’t get me wrong, I am NOT suggesting that Friday’s teeny tiny bit of data buried within a consumer survey means the bear market is over – or even that we’ve seen the bottom. However, what I am saying is that the path out of this market mess is beginning to come into focus.
To reiterate, the key to the bottom for this market is for investors to gain clarity on when the Fed will take a break. And hopefully sooner rather than later. This is important because it would mean Jay Powell & Company aren’t likely to wreck the economy in their quest to reduce inflation. And Friday’s report contained the very first data point that just might give the FOMC a reason to pause after another big hike or two.
For those looking for other hopeful signs, I’ve got something that might brighten your day on this fine Monday morning. Below is the latest update to the Cycle Composite put together by Ned Davis Research Group.
To review, the Cycle Composite takes three historical cycles (the one year seasonal, the 4-year Presidential, and the 10-year decennial cycles) and mashes them together. The computer then spits out a projection of what the year might look like – in advance.
As I’ve mentioned a time or twenty over the years, Wall Street loves their historical analogs. As such, the Cycle Composite oftentimes winds up being a pretty good guide as to what to expect from the stock market in the months ahead.
Granted, there are times when the market is completely out of sync with the Cycle Composite and goes on its merry way without an iota of consideration for historical cycles. But then there are other times when this thing is very good, as in “scary good.” Like now, for instance.
NDR Cycle Composite 2022

View Chart Online
Image Source: Ned Davis Research Group
When the Cycle Composite was updated for 2022 in early January, I figured that the cycles might be off – maybe even way off this year. After all, the market had just hit all-time highs and things were looking up. Silly me.
As you can plainly see, the stock market has been largely following the Cycle Composite’s projections this year. And it is worth noting that the S&P 500 is within a hair of where the Cycle Composite suggested it would be at mid-year. Interesting!
The good news is history suggests that the bottom may be very close at hand. And that from there, stocks will move higher in a stair-step fashion in the second half of the year. I don’t know about you, but I’d take it!
So, will history continue to be a guide for the rest of 2022? Or is this one of those times when the Cycle Composite goes off the rails? Only time will tell, of course. However, during times like these, I think it is important to remember that bear markets DO end at some point (usually within about a year of beginning) and in turn, the next strong investing opportunity will be born – at some point.
Lest we forget, according to the computers at Ned Davis Research Group, the average bull market produces gains of 85.9% and Cyclical Bull Markets that occur within an ongoing Secular Bull Cycle (the assumed case for what we are experiencing now) see mean returns of more than 105%. Something to look forward to, right!
No, I don’t know when the turn will occur – when the bear will morph into a new bull. But I have been investing other people’s money for a living for more than 35 years now, and one thing I’ve learned is that markets based on the fear of what might happen tend to pass more quickly and that one must be ready for the next opportunity!
So, while I have been putting some money to work into the depths of this bear and I still have a fair amount of dry powder in the discretionary accounts I manage, I am starting to get interested in putting more cash back to work. Not all at once, mind you. No, you have to be prudent and try to use price action to your advantage. But the bottom line is I am looking forward to the next phase.
Here’s hoping the market remains in sync with Cycle Composite projections for the rest of the year.
Now let’s review the “state of the market” through the lens of our market models…
The Big-Picture Market Models
We start with six of our favorite long-term market models. These models are designed to help determine the “state” of the overall market.
* Source: Ned Davis Research (NDR) as of the date of publication. Historical returns are hypothetical average annual performances calculated by NDR.
The Fundamental Backdrop
Next, we review the market’s fundamental factors including interest rates, the economy, earnings, inflation, and valuations.
* Source: Ned Davis Research (NDR) as of the date of publication. Historical returns are hypothetical average annual performances calculated by NDR.
The State of the Trend
After reviewing the big-picture models and the fundamental backdrop, I like to look at the state of the current trend. This board of indicators is designed to tell us about the overall technical health of the market’s trend.
The State of Internal Momentum
Next, we analyze the momentum indicators/models to determine if there is any “oomph” behind the current move.
* Source: Ned Davis Research (NDR) as of the date of publication. Historical returns are hypothetical average annual performances calculated by NDR.
Early Warning Indicators
Finally, we look at our early warning indicators to gauge the potential for countertrend moves. This batch of indicators is designed to suggest when the table is set for the trend to “go the other way.”
* Source: Ned Davis Research (NDR) as of the date of publication. Historical returns are hypothetical average annual performances calculated by NDR.
Thought for the Day:
Of all the hazards, fear is the worst. -Sam Snead
Market Models Explained
Wishing you green screens and all the best for a great day,
David D. Moenning
Director Institutional Consulting
Capital Advisors 360, LLC
Disclosures
At the time of publication, Mr. Moenning held long positions in the following securities mentioned:
None
– Note that positions may change at any time.
NOT INDIVIDUAL INVESTMENT ADVICE. IMPORTANT FURTHER DISCLOSURES
Tags: David Moenning, State of the Markets, Stock Market, Stocks, Stock Market Commentary, Stock Market Analysis, Investing
RECENT ARTICLES
The Time Has Come
The Market Panic Playbook
Bears Get Back In The Game
Sell in May, Except…
When Being Completely Wrong Works Out
Stronger For Longer?
Archives
Archives