The State of the Market
The market-jolting news this morning isn’t about the election results. There is no update on lawsuits or vote counts. No news on the state of the “blue wave.” No, on this fine Monday morning, the big news, the news that is pushing DJIA futures higher by more than 1,600 points, the news that is moving the Dow and S&P 500 to record highs – is about a vaccine for a virus that is currently surging out of control.
Cutting to the chase, this morning the Pfizer (PFE)/BioNTech (BNTX) partnership reported that preliminary results from the stage 3 trial of their coronavirus vaccine were more effective than expected. As in 90% effective. As in significantly above the 50% effective rate that is required for vaccine approval. As in much higher than the level Dr. Fauci and company had said would be acceptable.
Digging into the news, I also found it interesting/hopeful to learn that protection from the virus is achieved 28 days after the initial vaccination (which requires two doses). This means analysts can now begin to put a timeline on when the assault on the economies of the world might end. Let the discounting of better days begin.
As the CEO of Pfizer put it, this is a great day for science and humanity. Amen to that.
If the trial continues apace, the company reports that it could submit an application to the FDA for emergency use by the third week of November. Yes, November. And Pfizer/BioNTech project that they could produce up to 50 million vaccine doses yet this year. Yes, this year. And up to 1.3 billion doses in 2021.
Insert sigh of relief here. Insert hope for a move toward normalcy sooner rather than later. And insert a light at the end of what was beginning to look like a long, dark tunnel.
As you might expect, the “recovery trade” is popping this morning. Travel and the rest of the Leisure and Hospitality stocks are spiking higher. Etcetera, etcetera. In short, it’s game on for the bulls.
Weekend Musings
Long-time readers of my oftentimes meandering morning market missive likely know that I only listen to/read the opinions a handful of market analysts. I learned a long time ago that everyone has an opinion, and it is best not to listen to everything anyone spews. So, once an investor determines how they plan to manage money, I believe they need to only accept the input of those with applicable/appropriate time frames and views on the markets. (As an example, if you are a long-term investor, it doesn’t make much sense to hang on every word coming from all the fast-money trader types – who also have a tendency to “talk their books” whenever they get the chance.)
However, JP Morgan’s Marko Kolanovic, who is the head of the firm’s macro quantitative and derivatives strategy, is someone that I respect and pay attention to. Kolanovic’s team produces macro research that is unique and looks at capital flows that are hard to find. So, in short, when Marko talks about the macro view of the market, I tend to sit up and take notice.
Late last week, Mr. Kolanovic penned a report for clients which, in a nutshell, suggested that the outcome of the election could produce, “one of the most favorable scenarios for the market.”
Kolanovic wrote that a Biden presidency with a split Congress could result in a market-friendly environment with lower taxes, no increase to regulations, and an improved U.S.-China trade relationship. “A GOP senate majority should ensure that Trump’s pro-business policies stay intact (tax code, deregulation), and if Biden is confirmed we should be able to expect an easing of the trade war (which should boost global trade and corporate earnings growth),” Kolanovic said.
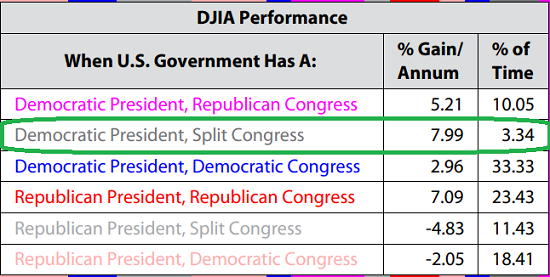
In support of Kolanovic’s view, allow me to present Exhibit A in the bull case. Below is a table produced by Ned Davis Research, which details the DJIA’s historical return from 3/30/1901 given the various combinations of Congressional and White House control.
View Larger Image
Source Ned Davis Research
As you can see, a Democratic President and a split Congress has produced the best returns over the last 120 years. Even better than total Republican control, which is perceived to be a pro-business scenario.
Granted, the state of the Senate is uncertain at this time as we won’t know the status of the two senate seats in Georgia until after January 5th. While the Democrats are hoping to win both seats, the GOP reminds us that GA has traditionally been a red state. As such, analysts I follow are expecting the Senate to remain in control of the Republicans. Albeit by the skinniest of margins.
Kolanovic also pointed out on Friday that we could see less volatility given that the onslaught of “market disrupting tweets,” is likely to end come January 20, 2021.
Looking ahead, Kolanovic appears to be optimistic. “We believe the market should continue moving higher as investors increase exposure to stocks… We also believe additional stimulus is possible, and we expect an end in sight for the COVID-19 pandemic with the imminent arrival of positive vaccine news. We expect equities to continue to rally.”
So, while I continue to have concerns about the state of the economy given the exponential rise in COVID cases and the potential for new, targeted lockdowns, (no, I’m not worried about a recession, but I am wondering where growth from here comes from) it is nice to start the week with some upbeat thoughts from someone whose work I respect. Oh, and for the record, Mr. Kolanovic was named the #1 analyst in this year’s Institutional Investor’s All-America Research Team ratings. So, again, when Marko talks, I tend to listen.
Now let’s turn to the state of my favorite big-picture market models…
The Big-Picture Market Models
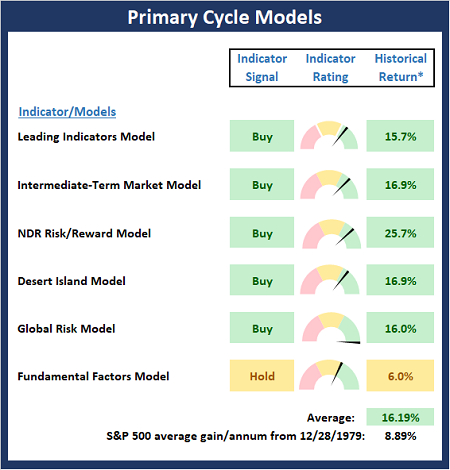
There are no obvious changes to report on the Primary Cycle board again this week. However, I note that the average historical return of the S&P 500 based on the current modes of the models improved to 16.2% from 13.9%. Digging into the readings of the individual models, it is worth noting that the mode and historical return of the Intermediate-Term Market Model upticked from neutral to positive last week. So, as I’ve been opining for some time now, I believe the board supports the idea that stocks remain in a cyclical bull market, which to me, suggests that investors with a longer-term time horizon should continue to stay onboard the bull train and be ready to “buy the dips.”
* Source: Ned Davis Research (NDR) as of the date of publication. Historical returns are hypothetical average annual performances calculated by NDR.
Checking On The “Primary” Cycles
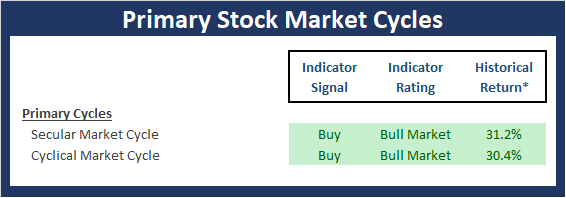
While I don’t often make portfolio adjustments based on the long-term trends in the stock market (aka the “primary cycles”), I have found over the years that checking in on state of the cycles and the weekly/monthly charts helps to keep the big-picture in perspective.
* Source: Ned Davis Research (NDR) as of the date of publication. Historical returns are hypothetical average annual performances calculated by NDR.
The Secular Market Cycle
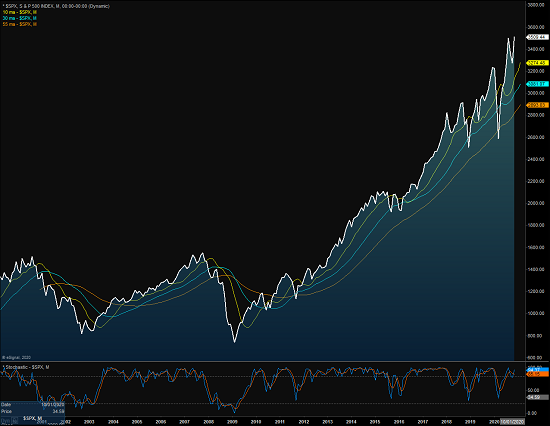
Definition: A secular bull market is a period in which stock prices rise at an above-average rate for an extended period (think 5 years or longer) and suffer only relatively short intervening declines. A secular bear market is an extended period of flat or declining stock prices. Secular bull or bear markets typically consist of multiple cyclical bull and bear markets. Below is a monthly chart of the S&P 500 Index illustrating the current cycle, which we estimate began on March 9, 2009.
S&P 500 – Monthly
View Full Size Chart Online
The Cyclical Market Cycle
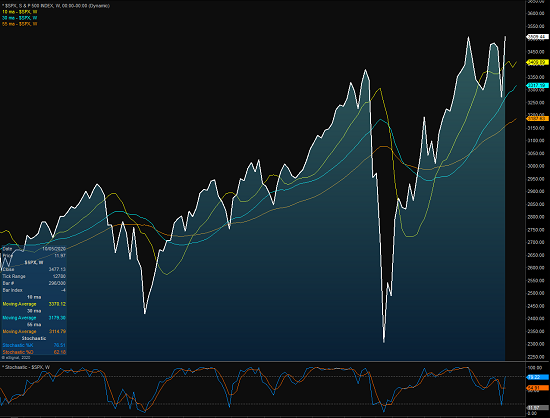
Definition: A cyclical bull market requires a 30% rise in the DJIA after 50 calendar days or a 13% rise after 155 calendar days. Reversals of 30% in the Value Line Geometric Index since 1965 also qualify. A cyclical bear market requires a 30% drop in the DJIA after 50 calendar days or a 13% decline after 145 calendar days. Reversals of 30% in the Value Line Geometric Index also qualify. Below is a weekly chart of the S&P 500 illustrating the current cycle, which we estimate began on March 24, 2020.
S&P 500 – Weekly
View Full Size Chart Online
Thought For The Day:
“Always stay humble and kind” -Tim McGraw
Market Models Explained
Wishing you green screens and all the best for a great day,

David D. Moenning
Director Institutional Consulting
Capital Advisors 360, LLC

Disclosures
At the time of publication, Mr. Moenning held long positions in the following securities mentioned:
none
Note that positions may change at any time.
NOT INDIVIDUAL INVESTMENT ADVICE. IMPORTANT FURTHER DISCLOSURES.


Institutional Consulting
David Moenning
Sigh Of Relief
The State of the Market
The market-jolting news this morning isn’t about the election results. There is no update on lawsuits or vote counts. No news on the state of the “blue wave.” No, on this fine Monday morning, the big news, the news that is pushing DJIA futures higher by more than 1,600 points, the news that is moving the Dow and S&P 500 to record highs – is about a vaccine for a virus that is currently surging out of control.
Cutting to the chase, this morning the Pfizer (PFE)/BioNTech (BNTX) partnership reported that preliminary results from the stage 3 trial of their coronavirus vaccine were more effective than expected. As in 90% effective. As in significantly above the 50% effective rate that is required for vaccine approval. As in much higher than the level Dr. Fauci and company had said would be acceptable.
Digging into the news, I also found it interesting/hopeful to learn that protection from the virus is achieved 28 days after the initial vaccination (which requires two doses). This means analysts can now begin to put a timeline on when the assault on the economies of the world might end. Let the discounting of better days begin.
As the CEO of Pfizer put it, this is a great day for science and humanity. Amen to that.
If the trial continues apace, the company reports that it could submit an application to the FDA for emergency use by the third week of November. Yes, November. And Pfizer/BioNTech project that they could produce up to 50 million vaccine doses yet this year. Yes, this year. And up to 1.3 billion doses in 2021.
Insert sigh of relief here. Insert hope for a move toward normalcy sooner rather than later. And insert a light at the end of what was beginning to look like a long, dark tunnel.
As you might expect, the “recovery trade” is popping this morning. Travel and the rest of the Leisure and Hospitality stocks are spiking higher. Etcetera, etcetera. In short, it’s game on for the bulls.
Weekend Musings
Long-time readers of my oftentimes meandering morning market missive likely know that I only listen to/read the opinions a handful of market analysts. I learned a long time ago that everyone has an opinion, and it is best not to listen to everything anyone spews. So, once an investor determines how they plan to manage money, I believe they need to only accept the input of those with applicable/appropriate time frames and views on the markets. (As an example, if you are a long-term investor, it doesn’t make much sense to hang on every word coming from all the fast-money trader types – who also have a tendency to “talk their books” whenever they get the chance.)
However, JP Morgan’s Marko Kolanovic, who is the head of the firm’s macro quantitative and derivatives strategy, is someone that I respect and pay attention to. Kolanovic’s team produces macro research that is unique and looks at capital flows that are hard to find. So, in short, when Marko talks about the macro view of the market, I tend to sit up and take notice.
Late last week, Mr. Kolanovic penned a report for clients which, in a nutshell, suggested that the outcome of the election could produce, “one of the most favorable scenarios for the market.”
Kolanovic wrote that a Biden presidency with a split Congress could result in a market-friendly environment with lower taxes, no increase to regulations, and an improved U.S.-China trade relationship. “A GOP senate majority should ensure that Trump’s pro-business policies stay intact (tax code, deregulation), and if Biden is confirmed we should be able to expect an easing of the trade war (which should boost global trade and corporate earnings growth),” Kolanovic said.
In support of Kolanovic’s view, allow me to present Exhibit A in the bull case. Below is a table produced by Ned Davis Research, which details the DJIA’s historical return from 3/30/1901 given the various combinations of Congressional and White House control.
View Larger Image
Source Ned Davis Research
As you can see, a Democratic President and a split Congress has produced the best returns over the last 120 years. Even better than total Republican control, which is perceived to be a pro-business scenario.
Granted, the state of the Senate is uncertain at this time as we won’t know the status of the two senate seats in Georgia until after January 5th. While the Democrats are hoping to win both seats, the GOP reminds us that GA has traditionally been a red state. As such, analysts I follow are expecting the Senate to remain in control of the Republicans. Albeit by the skinniest of margins.
Kolanovic also pointed out on Friday that we could see less volatility given that the onslaught of “market disrupting tweets,” is likely to end come January 20, 2021.
Looking ahead, Kolanovic appears to be optimistic. “We believe the market should continue moving higher as investors increase exposure to stocks… We also believe additional stimulus is possible, and we expect an end in sight for the COVID-19 pandemic with the imminent arrival of positive vaccine news. We expect equities to continue to rally.”
So, while I continue to have concerns about the state of the economy given the exponential rise in COVID cases and the potential for new, targeted lockdowns, (no, I’m not worried about a recession, but I am wondering where growth from here comes from) it is nice to start the week with some upbeat thoughts from someone whose work I respect. Oh, and for the record, Mr. Kolanovic was named the #1 analyst in this year’s Institutional Investor’s All-America Research Team ratings. So, again, when Marko talks, I tend to listen.
Now let’s turn to the state of my favorite big-picture market models…
The Big-Picture Market Models
There are no obvious changes to report on the Primary Cycle board again this week. However, I note that the average historical return of the S&P 500 based on the current modes of the models improved to 16.2% from 13.9%. Digging into the readings of the individual models, it is worth noting that the mode and historical return of the Intermediate-Term Market Model upticked from neutral to positive last week. So, as I’ve been opining for some time now, I believe the board supports the idea that stocks remain in a cyclical bull market, which to me, suggests that investors with a longer-term time horizon should continue to stay onboard the bull train and be ready to “buy the dips.”
* Source: Ned Davis Research (NDR) as of the date of publication. Historical returns are hypothetical average annual performances calculated by NDR.
Checking On The “Primary” Cycles
While I don’t often make portfolio adjustments based on the long-term trends in the stock market (aka the “primary cycles”), I have found over the years that checking in on state of the cycles and the weekly/monthly charts helps to keep the big-picture in perspective.
* Source: Ned Davis Research (NDR) as of the date of publication. Historical returns are hypothetical average annual performances calculated by NDR.
The Secular Market Cycle
Definition: A secular bull market is a period in which stock prices rise at an above-average rate for an extended period (think 5 years or longer) and suffer only relatively short intervening declines. A secular bear market is an extended period of flat or declining stock prices. Secular bull or bear markets typically consist of multiple cyclical bull and bear markets. Below is a monthly chart of the S&P 500 Index illustrating the current cycle, which we estimate began on March 9, 2009.
S&P 500 – Monthly

View Full Size Chart Online
The Cyclical Market Cycle
Definition: A cyclical bull market requires a 30% rise in the DJIA after 50 calendar days or a 13% rise after 155 calendar days. Reversals of 30% in the Value Line Geometric Index since 1965 also qualify. A cyclical bear market requires a 30% drop in the DJIA after 50 calendar days or a 13% decline after 145 calendar days. Reversals of 30% in the Value Line Geometric Index also qualify. Below is a weekly chart of the S&P 500 illustrating the current cycle, which we estimate began on March 24, 2020.
S&P 500 – Weekly

View Full Size Chart Online
Thought For The Day:
“Always stay humble and kind” -Tim McGraw
Market Models Explained
Wishing you green screens and all the best for a great day,
David D. Moenning
Director Institutional Consulting
Capital Advisors 360, LLC
Disclosures
At the time of publication, Mr. Moenning held long positions in the following securities mentioned:
none
Note that positions may change at any time.
NOT INDIVIDUAL INVESTMENT ADVICE. IMPORTANT FURTHER DISCLOSURES.
RECENT ARTICLES
The Time Has Come
The Market Panic Playbook
Bears Get Back In The Game
Sell in May, Except…
When Being Completely Wrong Works Out
Stronger For Longer?
Archives
Archives