While there is still time for the traditional Santa Claus rally to begin, the current correction in stocks, which so far at least falls into the “garden variety” category, goes against the positive market vibe typically seen at this time of year.
It would be easy to say that the recent volatility is being driven by Omicron. After all, there is a lot we don’t know about the latest COVID variant, which creates uncertainty in the markets. And if there is anything I’ve learned in my 34 years of professional portfolio management, it is that Ms. Market hates uncertainty.
So far at least, it appears that Omicron is much more transmissible than Delta but the degree of illness inflicted is less severe. Assuming this narrative holds as scientists collect the data in the coming weeks, analysts are saying that this variant isn’t likely to impact economic growth, and, in turn, EPS, to any great degree. As such, one can argue that as long as things on the virus front don’t worsen significantly, investors should be looking past the latest scare and get ready to buy the dip.
But… I believe there is another, more important issue in play here that is causing traders some serious angst. In short, the worry is that the Fed is about to make a mistake.
Last week, Jay Powell made a U-turn in terms of the Fed’s messaging. Instead of going out of his way to explain why inflation is likely to be “transitory,” the Fed Chair surprised markets by announcing it is time to retire what to this point had been his favorite adjective for inflation.
Anyone looking at the data can see there are components of the inflation indices that are unlikely to continue at the current torrid pace. Yet with wages on the rise and home prices moving steadily northward due to increased demand caused by the WFH movement, it is also easy to argue that some aspects of inflation could easily become entrenched.
The problem is with Mr. Powell knowing his job is secure, he and his merry band of U.S. central bankers can turn their attention to removing the extreme stimulative measure put in place to fight off the economic impact of the pandemic. As in speeding up the taper. As in raising rates from the zero-bound sooner – which is something many argue the Fed waited too long to do after the Great Financial Crisis.
To be sure, this all sounds like a good plan. Remove the 800-pound gorilla from the bond market. Get rates back to something a little more “normal.” And let the economy and the markets function on their own.
The issue traders appear to be having here is the timing of the plan. The fear is the Fed will begin tightening (I.E., raising rates) as the economy begins weakening, which, as the argument goes, could exacerbate the slowdown. And the bottom line here seems to be that #GrowthSlowing hasn’t been in traders’ collective vocabulary for some time – which, of course, helps explain why stocks were at or near all-time highs not too long ago.
Suddenly, we are starting to hear talk of “the R word” again. Right at the time when the economy seems to be humming along better than expected. Thus, the upbeat view of future expectations looks to be sagging. And cutting to the chase, this is the stuff that corrections are made of.
In English, my take is that stock prices are pulling back to reflect the current virus uncertainty as well as the potential for (a) a policy misstep and (b) slower growth ahead. Makes sense, right?
So, from my seat, it looks like Santa is being tested. Here’s hoping it’s a rapid test!
Next, let’s review the “state of the market” through the lens of our market models…
The Big-Picture Market Models
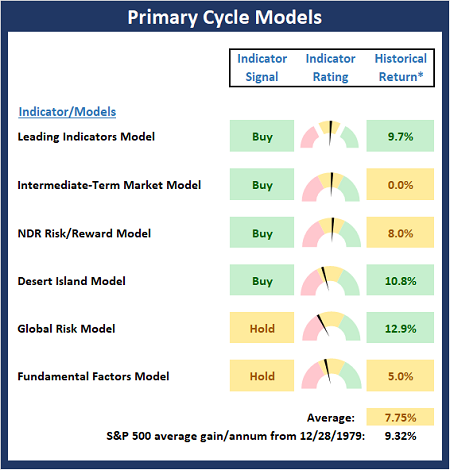
We start with six of our favorite long-term market models. These models are designed to help determine the “state” of the overall market.
* Source: Ned Davis Research (NDR) as of the date of publication. Historical returns are hypothetical average annual performances calculated by NDR.
Current Take: Big Picture Models
Although market volatility has picked up considerably, there is no change to the Primary Cycle Board this week. My view is the big-picture models are telling us there are no indications that a bear market is developing. So, as long as this board remains in good shape, we should view the current action as a corrective phase.
The Fundamental Backdrop
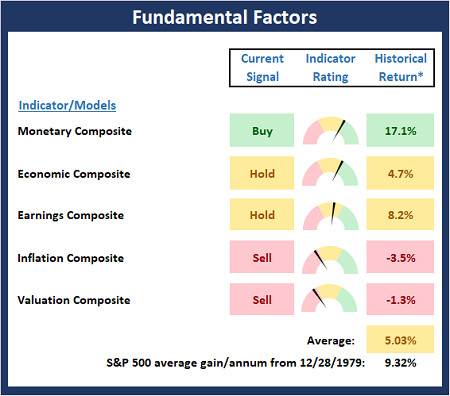
Next, we review the market’s fundamental factors including interest rates, the economy, earnings, inflation, and valuations.
* Source: Ned Davis Research (NDR) as of the date of publication. Historical returns are hypothetical average annual performances calculated by NDR.
Current Take: Fundamental Models
Ditto on the Fundamental Board – no changes to report this week. However, as I’ve been saying for some time, the board suggests that risk remains elevated from a macro perspective.
The State of the Trend
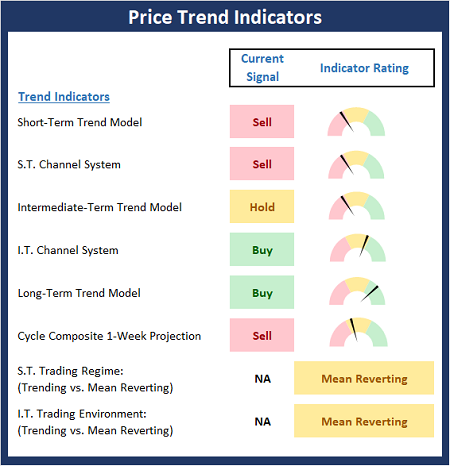
After reviewing the big-picture models and the fundamental backdrop, I like to look at the state of the current trend. This board of indicators is designed to tell us about the overall technical health of the market’s trend.
Current Take: Trend Models
Not surprisingly, the Trend Board slumped a bit more last week as the Intermediate-Term Trend model moved to neutral and the cycle composite flipped to negative for the next two weeks (it’s tax-selling season).
The State of Internal Momentum
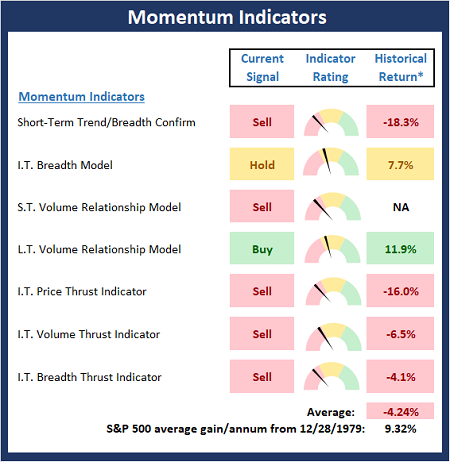
Next, we analyze the momentum indicators/models to determine if there is any “oomph” behind the current move.
* Source: Ned Davis Research (NDR) as of the date of publication. Historical returns are hypothetical average annual performances calculated by NDR.
Current Take: Momentum Models
The Momentum Board weakened again last week as the Short-Term Volume Relationship model moved to negative. Recall I said last week that the board suggested some additional weakness was likely. So, now we wait and see where the bulls will try to make a stand.
Early Warning Indicators
Finally, we look at our early warning indicators to gauge the potential for countertrend moves. This batch of indicators is designed to suggest when the table is set for the trend to “go the other way.”
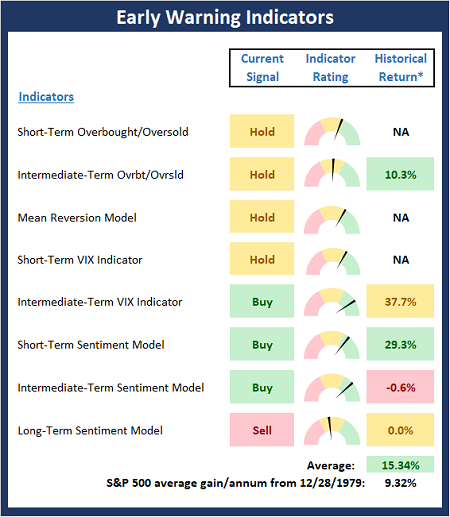
* Source: Ned Davis Research (NDR) as of the date of publication. Historical returns are hypothetical average annual performances calculated by NDR.
Current Take: Early Warning Models
The Early Warning Board continues to improve and now favors the bulls. This tells me to start looking for some bottoming action in the near-term.
Thought for the Day:
Your character is what you really are; your reputation is merely what people think you are. -John Wooden
Market Models Explained
Wishing you green screens and all the best for a great day,

David D. Moenning
Director Institutional Consulting
Capital Advisors 360, LLC

Disclosures
At the time of publication, Mr. Moenning held long positions in the following securities mentioned:
None
– Note that positions may change at any time.
NOT INDIVIDUAL INVESTMENT ADVICE. IMPORTANT FURTHER DISCLOSURES
Tags: David Moenning, State of the Markets, Stock Market, Stocks, Stock Market Commentary, Stock Market Analysis, Investing


Institutional Consulting
David Moenning
Santa Is Being Tested
While there is still time for the traditional Santa Claus rally to begin, the current correction in stocks, which so far at least falls into the “garden variety” category, goes against the positive market vibe typically seen at this time of year.
It would be easy to say that the recent volatility is being driven by Omicron. After all, there is a lot we don’t know about the latest COVID variant, which creates uncertainty in the markets. And if there is anything I’ve learned in my 34 years of professional portfolio management, it is that Ms. Market hates uncertainty.
So far at least, it appears that Omicron is much more transmissible than Delta but the degree of illness inflicted is less severe. Assuming this narrative holds as scientists collect the data in the coming weeks, analysts are saying that this variant isn’t likely to impact economic growth, and, in turn, EPS, to any great degree. As such, one can argue that as long as things on the virus front don’t worsen significantly, investors should be looking past the latest scare and get ready to buy the dip.
But… I believe there is another, more important issue in play here that is causing traders some serious angst. In short, the worry is that the Fed is about to make a mistake.
Last week, Jay Powell made a U-turn in terms of the Fed’s messaging. Instead of going out of his way to explain why inflation is likely to be “transitory,” the Fed Chair surprised markets by announcing it is time to retire what to this point had been his favorite adjective for inflation.
Anyone looking at the data can see there are components of the inflation indices that are unlikely to continue at the current torrid pace. Yet with wages on the rise and home prices moving steadily northward due to increased demand caused by the WFH movement, it is also easy to argue that some aspects of inflation could easily become entrenched.
The problem is with Mr. Powell knowing his job is secure, he and his merry band of U.S. central bankers can turn their attention to removing the extreme stimulative measure put in place to fight off the economic impact of the pandemic. As in speeding up the taper. As in raising rates from the zero-bound sooner – which is something many argue the Fed waited too long to do after the Great Financial Crisis.
To be sure, this all sounds like a good plan. Remove the 800-pound gorilla from the bond market. Get rates back to something a little more “normal.” And let the economy and the markets function on their own.
The issue traders appear to be having here is the timing of the plan. The fear is the Fed will begin tightening (I.E., raising rates) as the economy begins weakening, which, as the argument goes, could exacerbate the slowdown. And the bottom line here seems to be that #GrowthSlowing hasn’t been in traders’ collective vocabulary for some time – which, of course, helps explain why stocks were at or near all-time highs not too long ago.
Suddenly, we are starting to hear talk of “the R word” again. Right at the time when the economy seems to be humming along better than expected. Thus, the upbeat view of future expectations looks to be sagging. And cutting to the chase, this is the stuff that corrections are made of.
In English, my take is that stock prices are pulling back to reflect the current virus uncertainty as well as the potential for (a) a policy misstep and (b) slower growth ahead. Makes sense, right?
So, from my seat, it looks like Santa is being tested. Here’s hoping it’s a rapid test!
Next, let’s review the “state of the market” through the lens of our market models…
The Big-Picture Market Models
We start with six of our favorite long-term market models. These models are designed to help determine the “state” of the overall market.
* Source: Ned Davis Research (NDR) as of the date of publication. Historical returns are hypothetical average annual performances calculated by NDR.
Current Take: Big Picture Models
Although market volatility has picked up considerably, there is no change to the Primary Cycle Board this week. My view is the big-picture models are telling us there are no indications that a bear market is developing. So, as long as this board remains in good shape, we should view the current action as a corrective phase.
The Fundamental Backdrop
Next, we review the market’s fundamental factors including interest rates, the economy, earnings, inflation, and valuations.
* Source: Ned Davis Research (NDR) as of the date of publication. Historical returns are hypothetical average annual performances calculated by NDR.
Current Take: Fundamental Models
Ditto on the Fundamental Board – no changes to report this week. However, as I’ve been saying for some time, the board suggests that risk remains elevated from a macro perspective.
The State of the Trend
After reviewing the big-picture models and the fundamental backdrop, I like to look at the state of the current trend. This board of indicators is designed to tell us about the overall technical health of the market’s trend.
Current Take: Trend Models
Not surprisingly, the Trend Board slumped a bit more last week as the Intermediate-Term Trend model moved to neutral and the cycle composite flipped to negative for the next two weeks (it’s tax-selling season).
The State of Internal Momentum
Next, we analyze the momentum indicators/models to determine if there is any “oomph” behind the current move.
* Source: Ned Davis Research (NDR) as of the date of publication. Historical returns are hypothetical average annual performances calculated by NDR.
Current Take: Momentum Models
The Momentum Board weakened again last week as the Short-Term Volume Relationship model moved to negative. Recall I said last week that the board suggested some additional weakness was likely. So, now we wait and see where the bulls will try to make a stand.
Early Warning Indicators
Finally, we look at our early warning indicators to gauge the potential for countertrend moves. This batch of indicators is designed to suggest when the table is set for the trend to “go the other way.”
* Source: Ned Davis Research (NDR) as of the date of publication. Historical returns are hypothetical average annual performances calculated by NDR.
Current Take: Early Warning Models
The Early Warning Board continues to improve and now favors the bulls. This tells me to start looking for some bottoming action in the near-term.
Thought for the Day:
Your character is what you really are; your reputation is merely what people think you are. -John Wooden
Market Models Explained
Wishing you green screens and all the best for a great day,
David D. Moenning
Director Institutional Consulting
Capital Advisors 360, LLC
Disclosures
At the time of publication, Mr. Moenning held long positions in the following securities mentioned:
None
– Note that positions may change at any time.
NOT INDIVIDUAL INVESTMENT ADVICE. IMPORTANT FURTHER DISCLOSURES
Tags: David Moenning, State of the Markets, Stock Market, Stocks, Stock Market Commentary, Stock Market Analysis, Investing
RECENT ARTICLES
The Time Has Come
The Market Panic Playbook
Bears Get Back In The Game
Sell in May, Except…
When Being Completely Wrong Works Out
Stronger For Longer?
Archives
Archives