Longtime readers know that the primary purpose of my oftentimes meandering market missive is to identify the primary drivers of the market action. The idea is that if you know what is driving prices on a daily/weekly basis then you have a decent shot at staying in tune with primary trends.
One additional caveat before we dive into what’s driving the action currently is that this exercise does not allow for personal judgement of what is happening. I learned a long time ago that Ms. Market doesn’t give a hoot about what I think “should” be happening. As such, the idea is to focus on what “is” happening in the market and try to ascertain why.
So, without further ado, let’s get to it. Coming into the Thanksgiving holiday, the drivers of the market action were pretty straightforward. A surge in COVID cases in places like Austria, Germany, and Netherlands, created new lockdowns, which, in turn, caused some concern about the vibrancy of economic growth going forward, to say nothing of the “reopening” trade that had been getting a lot of support.
In addition, there was the ongoing fear about inflation becoming entrenched, an argument that seemed to gain traction with each passing data print. This, of course, caused traders to expect higher interest rates and the potential for the Fed to act sooner rather than later.
On the economic front, it appears that things were going better than expected. Exhibit A here would be the Atlanta Fed’s Q4 GDPNow index, which is designed to provide a real-time update on the pace economic activity. The measure started last week over 8.5, which was well above the consensus expectations as well as the 2.1% rate seen in the third quarter. Thus, my argument was that this might be the reason stock prices had been hovering around all-time highs and looking like they wanted to go higher.
Next up was the renomination of Jerome Powell for another term as Fed Chairman on Monday. While the continuity was seen as a positive as Powell has had a steady hand during the pandemic, the announcement took some steam out of the “lower for longer” rate argument. Instead, traders quickly priced in “faster, sooner,” sending bond yields skyward almost immediately. And before you could calculate how long to cook this year’s bird, it looked like yields were about to embark on a new uptrend.
But that was then, and this is now. On Friday, we learned about a new letter in the Greek alphabet: Omicron. As in the latest variant of COVID that started showing up in South Africa. While scientists don’t know everything about the strain, they do know that it is heavily mutated. As such, the worry is that this particular version of COVID might be able to more easily penetrate the protections afforded by the current vaccines.
Traditionally the Friday after Thanksgiving is a sleepy half-day session for markets where most investment professionals are busy doing other things like hanging holiday lights, shopping online, or continuing to feast on those leftovers. However, this year was different – very different.
Instead of a boring affair, this Friday after Thanksgiving sported some downside volatility, something that is actually quite rare. From my seat, there was some panic in the air as the traders and their computers that were working Friday, had seen this movie before and everybody knew what to do.
“Oh boy, here we go again,” was the likely cry heard on trading floors Friday. So, instead of the modest lift the indices typically see the day after Thanksgiving, traders decided to sell first and ask questions later. Questions like, how severe is this new variant? Does it spread as fast as Delta, or faster? Is it more or less deadly? Do the current vaccines provide protection? And so on, and so on.
Even yours truly took some action – just in case. In my shorter-term, risk-managed, tactical portfolios, I moved some of our holdings from the S&P 500 (SPY) to the NASDAQ 100 (QQQ). While I had no reason to take more aggressive “risk off” measures, I figured that if Omicron was going to become a problem and a focal point for markets, then the more dependable earnings from those megacap names was a good place to be. We’ll see if additional defensive measures are warranted in the coming days/weeks, but this was a small start and hopefully a way to add some value to portfolios.
So, there you have it. From my seat, Omicron is likely the driver of the markets in the coming days. The latest news appears to be that the variant’s symptoms are quite mild, which I assume will be positive for markets. But we shall see – so, be sure to stick around, this is likely to be an interesting week!
Next, let’s review the “state of the market” through the lens of our market models…
The Big-Picture Market Models
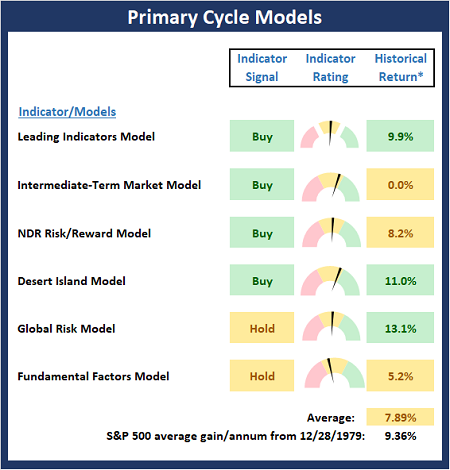
We start with six of our favorite long-term market models. These models are designed to help determine the “state” of the overall market.
* Source: Ned Davis Research (NDR) as of the date of publication. Historical returns are hypothetical average annual performances calculated by NDR.
Current Take: Big Picture Models
Although the Omicron variant may be tossing the market a curve ball from a near-term perspective, there is no change to the Primary Cycle Board this week. My takeaway is the big-picture remains bullish but a correction may be at hand.
The Fundamental Backdrop
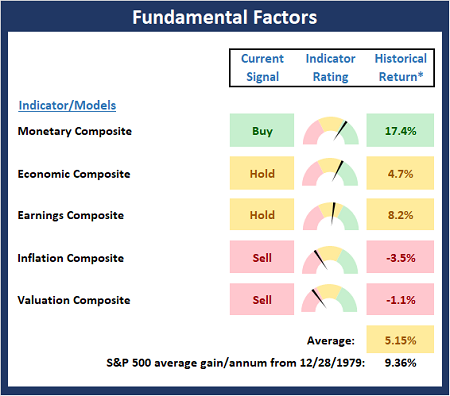
Next, we review the market’s fundamental factors including interest rates, the economy, earnings, inflation, and valuations.
* Source: Ned Davis Research (NDR) as of the date of publication. Historical returns are hypothetical average annual performances calculated by NDR.
Current Take: Fundamental Models
There are also no changes to the Fundamental Board to report this week. However, as I’ve been saying for some time now, the board suggests this is NOT a low-risk environment.
The State of the Trend
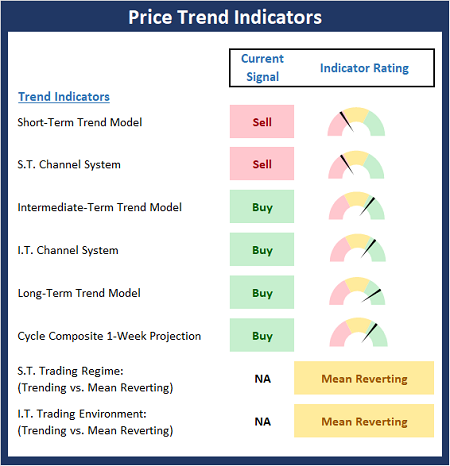
After reviewing the big-picture models and the fundamental backdrop, I like to look at the state of the current trend. This board of indicators is designed to tell us about the overall technical health of the market’s trend.
Current Take: Trend Models
As you would expect, the Trend Board slumped a bit last week as the Short-Term Trend and Channel models moved to sell signals and the S.T. Trading Regime flipped to Mean Reverting. We will be watching our intermediate-term indicators closely next week for signs of further weakness.
The State of Internal Momentum
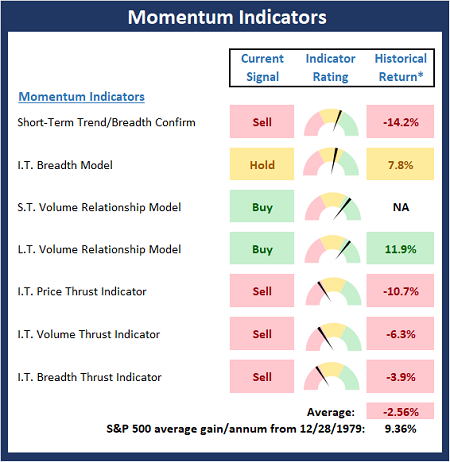
Next, we analyze the momentum indicators/models to determine if there is any “oomph” behind the current move.
* Source: Ned Davis Research (NDR) as of the date of publication. Historical returns are hypothetical average annual performances calculated by NDR.
Current Take: Momentum Models
The Momentum Board weakened more than I would have liked last week as the Short-Term Trend/Breadth, Intermediate-Term Price and Volume Thrust indicators all turned red while the I.T. Breadth model slipped to neutral. I believe the board is suggesting some additional weakness is likely.
Early Warning Indicators
Finally, we look at our early warning indicators to gauge the potential for countertrend moves. This batch of indicators is designed to suggest when the table is set for the trend to “go the other way.”
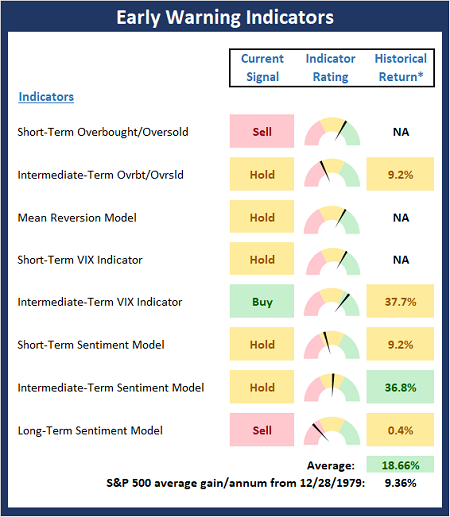
* Source: Ned Davis Research (NDR) as of the date of publication. Historical returns are hypothetical average annual performances calculated by NDR.
Current Take: Early Warning Models
The Early Warning Board improved a smidge last week and is now fairly neutral. As a reminder, the board did a very good job warning us that some downside action was possible – BEFORE it happened.
Thought for the Day:
The degree of unprofitable anxiety in an investor’s life corresponds directly to the amount of time one spends on how markets should be acting rather than the way an investment IS action. -Ned Davis
Market Models Explained
Wishing you green screens and all the best for a great day,

David D. Moenning
Director Institutional Consulting
Capital Advisors 360, LLC

Disclosures
At the time of publication, Mr. Moenning held long positions in the following securities mentioned:
SPY, QQQ
– Note that positions may change at any time.
NOT INDIVIDUAL INVESTMENT ADVICE. IMPORTANT FURTHER DISCLOSURES
Tags: David Moenning, State of the Markets, Stock Market, Stocks, Stock Market Commentary, Stock Market Analysis, Investing


Institutional Consulting
David Moenning
Learning A New Letter
Longtime readers know that the primary purpose of my oftentimes meandering market missive is to identify the primary drivers of the market action. The idea is that if you know what is driving prices on a daily/weekly basis then you have a decent shot at staying in tune with primary trends.
One additional caveat before we dive into what’s driving the action currently is that this exercise does not allow for personal judgement of what is happening. I learned a long time ago that Ms. Market doesn’t give a hoot about what I think “should” be happening. As such, the idea is to focus on what “is” happening in the market and try to ascertain why.
So, without further ado, let’s get to it. Coming into the Thanksgiving holiday, the drivers of the market action were pretty straightforward. A surge in COVID cases in places like Austria, Germany, and Netherlands, created new lockdowns, which, in turn, caused some concern about the vibrancy of economic growth going forward, to say nothing of the “reopening” trade that had been getting a lot of support.
In addition, there was the ongoing fear about inflation becoming entrenched, an argument that seemed to gain traction with each passing data print. This, of course, caused traders to expect higher interest rates and the potential for the Fed to act sooner rather than later.
On the economic front, it appears that things were going better than expected. Exhibit A here would be the Atlanta Fed’s Q4 GDPNow index, which is designed to provide a real-time update on the pace economic activity. The measure started last week over 8.5, which was well above the consensus expectations as well as the 2.1% rate seen in the third quarter. Thus, my argument was that this might be the reason stock prices had been hovering around all-time highs and looking like they wanted to go higher.
Next up was the renomination of Jerome Powell for another term as Fed Chairman on Monday. While the continuity was seen as a positive as Powell has had a steady hand during the pandemic, the announcement took some steam out of the “lower for longer” rate argument. Instead, traders quickly priced in “faster, sooner,” sending bond yields skyward almost immediately. And before you could calculate how long to cook this year’s bird, it looked like yields were about to embark on a new uptrend.
But that was then, and this is now. On Friday, we learned about a new letter in the Greek alphabet: Omicron. As in the latest variant of COVID that started showing up in South Africa. While scientists don’t know everything about the strain, they do know that it is heavily mutated. As such, the worry is that this particular version of COVID might be able to more easily penetrate the protections afforded by the current vaccines.
Traditionally the Friday after Thanksgiving is a sleepy half-day session for markets where most investment professionals are busy doing other things like hanging holiday lights, shopping online, or continuing to feast on those leftovers. However, this year was different – very different.
Instead of a boring affair, this Friday after Thanksgiving sported some downside volatility, something that is actually quite rare. From my seat, there was some panic in the air as the traders and their computers that were working Friday, had seen this movie before and everybody knew what to do.
“Oh boy, here we go again,” was the likely cry heard on trading floors Friday. So, instead of the modest lift the indices typically see the day after Thanksgiving, traders decided to sell first and ask questions later. Questions like, how severe is this new variant? Does it spread as fast as Delta, or faster? Is it more or less deadly? Do the current vaccines provide protection? And so on, and so on.
Even yours truly took some action – just in case. In my shorter-term, risk-managed, tactical portfolios, I moved some of our holdings from the S&P 500 (SPY) to the NASDAQ 100 (QQQ). While I had no reason to take more aggressive “risk off” measures, I figured that if Omicron was going to become a problem and a focal point for markets, then the more dependable earnings from those megacap names was a good place to be. We’ll see if additional defensive measures are warranted in the coming days/weeks, but this was a small start and hopefully a way to add some value to portfolios.
So, there you have it. From my seat, Omicron is likely the driver of the markets in the coming days. The latest news appears to be that the variant’s symptoms are quite mild, which I assume will be positive for markets. But we shall see – so, be sure to stick around, this is likely to be an interesting week!
Next, let’s review the “state of the market” through the lens of our market models…
The Big-Picture Market Models
We start with six of our favorite long-term market models. These models are designed to help determine the “state” of the overall market.
* Source: Ned Davis Research (NDR) as of the date of publication. Historical returns are hypothetical average annual performances calculated by NDR.
Current Take: Big Picture Models
Although the Omicron variant may be tossing the market a curve ball from a near-term perspective, there is no change to the Primary Cycle Board this week. My takeaway is the big-picture remains bullish but a correction may be at hand.
The Fundamental Backdrop
Next, we review the market’s fundamental factors including interest rates, the economy, earnings, inflation, and valuations.
* Source: Ned Davis Research (NDR) as of the date of publication. Historical returns are hypothetical average annual performances calculated by NDR.
Current Take: Fundamental Models
There are also no changes to the Fundamental Board to report this week. However, as I’ve been saying for some time now, the board suggests this is NOT a low-risk environment.
The State of the Trend
After reviewing the big-picture models and the fundamental backdrop, I like to look at the state of the current trend. This board of indicators is designed to tell us about the overall technical health of the market’s trend.
Current Take: Trend Models
As you would expect, the Trend Board slumped a bit last week as the Short-Term Trend and Channel models moved to sell signals and the S.T. Trading Regime flipped to Mean Reverting. We will be watching our intermediate-term indicators closely next week for signs of further weakness.
The State of Internal Momentum
Next, we analyze the momentum indicators/models to determine if there is any “oomph” behind the current move.
* Source: Ned Davis Research (NDR) as of the date of publication. Historical returns are hypothetical average annual performances calculated by NDR.
Current Take: Momentum Models
The Momentum Board weakened more than I would have liked last week as the Short-Term Trend/Breadth, Intermediate-Term Price and Volume Thrust indicators all turned red while the I.T. Breadth model slipped to neutral. I believe the board is suggesting some additional weakness is likely.
Early Warning Indicators
Finally, we look at our early warning indicators to gauge the potential for countertrend moves. This batch of indicators is designed to suggest when the table is set for the trend to “go the other way.”
* Source: Ned Davis Research (NDR) as of the date of publication. Historical returns are hypothetical average annual performances calculated by NDR.
Current Take: Early Warning Models
The Early Warning Board improved a smidge last week and is now fairly neutral. As a reminder, the board did a very good job warning us that some downside action was possible – BEFORE it happened.
Thought for the Day:
The degree of unprofitable anxiety in an investor’s life corresponds directly to the amount of time one spends on how markets should be acting rather than the way an investment IS action. -Ned Davis
Market Models Explained
Wishing you green screens and all the best for a great day,
David D. Moenning
Director Institutional Consulting
Capital Advisors 360, LLC
Disclosures
At the time of publication, Mr. Moenning held long positions in the following securities mentioned:
SPY, QQQ
– Note that positions may change at any time.
NOT INDIVIDUAL INVESTMENT ADVICE. IMPORTANT FURTHER DISCLOSURES
Tags: David Moenning, State of the Markets, Stock Market, Stocks, Stock Market Commentary, Stock Market Analysis, Investing
RECENT ARTICLES
The Time Has Come
The Market Panic Playbook
Bears Get Back In The Game
Sell in May, Except…
When Being Completely Wrong Works Out
Stronger For Longer?
Archives
Archives