The State of the Market
It appears that all anyone wants to talk about these days is “Gamestonk!” And frankly, I can’t blame them. When a stock soars more 16 times in a matter of 12 trading days, it certainly gets your attention!
For those of you keeping score at home, Gamestock (GME) closed at $19.95 on January 12th. This was actually quite an achievement as the stock had spent much of last summer under $5. There was a great deal of concern about the viability of the business model and the company itself. But then the Reddit rebellion took control. And before you could gather your W-2’s for your accountant, GME has exploded to nearly $500, closing last Thursday at $325.
Sure, the ride has been more than a little bumpy, with declines of 15-50% occurring along the way. In fact, GME plunged -44% last Thursday as brokerage firms large and small started placing restrictions on trading. But in the interest of staying on good terms with the millions of “little guy” traders now trading at home, this situation was quickly corrected (well, at least to some degree) and GME rebounded a cool +68% on Friday. And as one might expect, today the stock is down about -30% as I type.
The stories of money made during this period are mind bending. I know one young man who made $27,000 on his $2,000 investment – last week. And there are no shortage of stories that are likely to become legendary for those r/wallstreetbets folks who played this game with options.
The question of the day – especially among those unhip, meme-challenged, gray-haired traditional portfolio managers – is whether we are witnessing a Reddit Revolution in investing, or just the latest in a long string of bubbles. Most of which didn’t end well.
The meme-trader crowd contends that GME is here to stay as they are simply willing the company up from the brink of bankruptcy. Wall Street hedge fund such as Melvin Capital (and by association, the mighty Citadel and Steve Cohen’s Point 72) had shorted the youngin’s Gamestop, assuming that Chapter 11 (or worse) was right around the corner.
But that was before what some are calling Occupy Wall Street 2.0 began. Once the millions of r/wallstreetbets followers took up the mantle, it was a brand-new game. A company that looked like it was about to fold was suddenly worth $22.6 billion (source: YCharts.com) as of Friday’s close. For the record, GME’s market cap was $1.31 on New Year’s eve. And by comparison, Best Buy (BBY) currently has a market cap of $27.4 billion.
Insane, right?
Even a Reddit newbie like me can understand that $GME ONLY, $NEVER SELL, etc., suggests that they want to hold this stock forever. Dreams of GME becoming the next Tesla likely abound.
However, I’ll contend that the move in GME isn’t completely controlled by the “little guys” as evidenced by a review of the trading tape. Very large block trades suggest that the hedgies themselves are in on the game. And one thing to know about the “fast money” is they like to take profits when they have them.
Then there is the concept that GME is a no-brainer short – as long as one has staying power to withstand the next attack from the meme-trader community. And with moves of -34% like we’re seeing this morning, you can rest assured that some shorts are making money here.
I think the key point here is no matter what the mania is, whether it be tulip-bulbs, web startups in 1999, or houses in 2006, all bubbles tend to burst at some point. You just never know when.
To any young meme-traders that may be out there reading this missive, yes, I get that you view this as an “us against them” or a David vs. Goliath situation here. But the bottom line is there just isn’t enough of you to keep GME elevated at “ridonkulous” levels for the long term.
What I’m trying to say is the GME move simply isn’t sustainable (and yes, you can place this statement in the “Duh!” category). And to be clear, this is NOT investing. It’s gambling on crowd behavior. So, if you are buying GME, please understand that the game could easily end in tears.
However, I DO recognize that the millions of r/wsb’ers and the like out there ARE indeed powerful enough to push almost anything to the moon – for a spell. For example, silver appears to be one the latest target of the meme-trading mob.
From my seat, I see this phenomena as a new momentum trading herd that is likely to stick around a while. Perhaps even longer than their beloved Gamestop!
Now let’s turn to the state of my favorite big-picture market models…
The Big-Picture Market Models
There are no changes to report on the Primary Cycle board this week. Given that five out of six models remain green, I believe it is best to continue to give the bulls the benefit of the doubt.
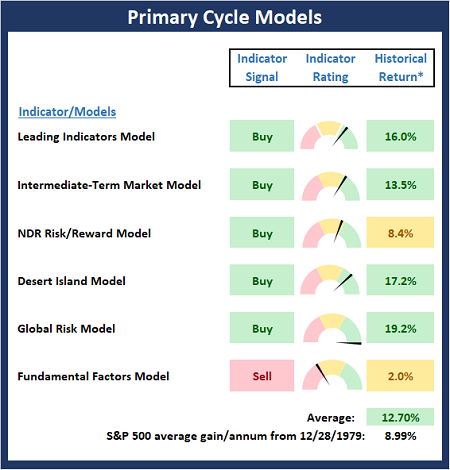
* Source: Ned Davis Research (NDR) as of the date of publication. Historical returns are hypothetical average annual performances calculated by NDR.
Fundamental Factor Models
There are no changes to the Fundamental board this week. However, as I have been saying for a few weeks now, I think it is important to recognize that there are no buy signals on the board, which tells me that risk is elevated.
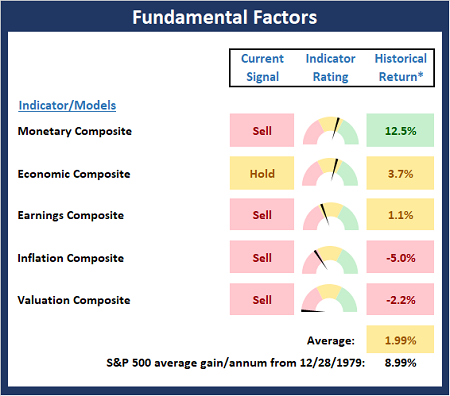
* Source: Ned Davis Research (NDR) as of the date of publication. Historical returns are hypothetical average annual performances calculated by NDR.
“Primary” Cycle History
I have found that checking in on state of the cycles and the weekly/monthly charts helps to keep the big-picture in perspective.
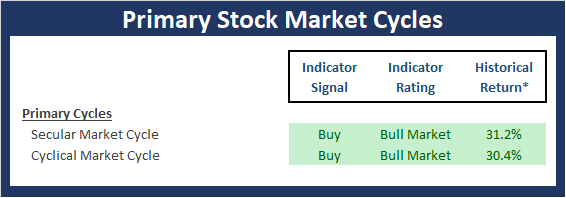
* Source: Ned Davis Research (NDR) as of the date of publication. Historical returns are hypothetical average annual performances calculated by NDR.
The Secular Market Cycle
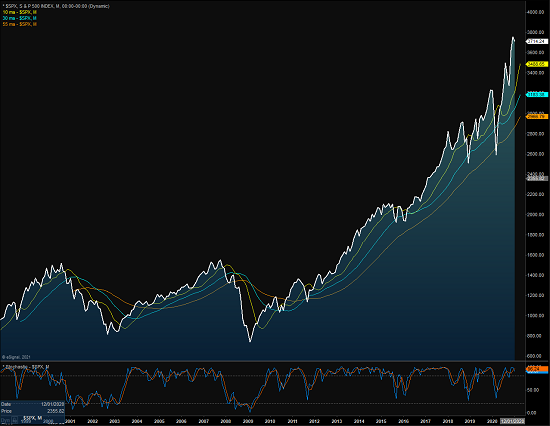
Below is a monthly chart of the S&P 500 Index illustrating the current cycle, which we estimate began on March 9, 2009.
S&P 500 – Monthly
View Full Size Chart Online
The Cyclical Market Cycle
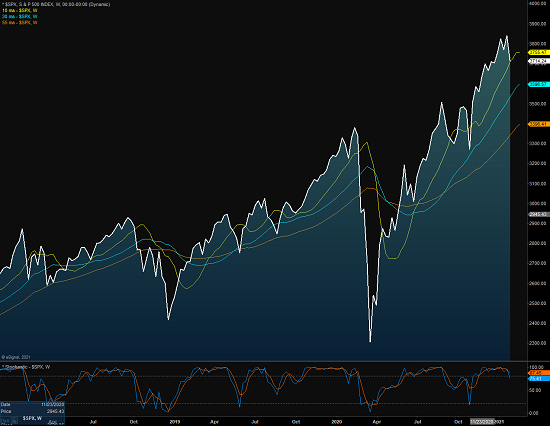
Below is a weekly chart of the S&P 500 illustrating the current cycle, which we estimate began on March 24, 2020.
S&P 500 – Weekly
View Full Size Chart Online
Thought for the Day:
Socialism works until you run out of other people’s money. -Margaret Thatcher
Market Models Explained
Wishing you green screens and all the best for a great day,

David D. Moenning
Director Institutional Consulting
Capital Advisors 360, LLC

Disclosures
At the time of publication, Mr. Moenning held long positions in the following securities mentioned:
none
– Note that positions may change at any time.
NOT INDIVIDUAL INVESTMENT ADVICE. IMPORTANT FURTHER DISCLOSURES
Tags: David Moenning, State of the Markets, Stock Market, Stocks, Stock Market Commentary, Stock Market Analysis, Investing, Gamestop, Reddit, r/wallstreetbets


Institutional Consulting
David Moenning
Is The Reddit Rebellion Here To Stay?
The State of the Market
It appears that all anyone wants to talk about these days is “Gamestonk!” And frankly, I can’t blame them. When a stock soars more 16 times in a matter of 12 trading days, it certainly gets your attention!
For those of you keeping score at home, Gamestock (GME) closed at $19.95 on January 12th. This was actually quite an achievement as the stock had spent much of last summer under $5. There was a great deal of concern about the viability of the business model and the company itself. But then the Reddit rebellion took control. And before you could gather your W-2’s for your accountant, GME has exploded to nearly $500, closing last Thursday at $325.
Sure, the ride has been more than a little bumpy, with declines of 15-50% occurring along the way. In fact, GME plunged -44% last Thursday as brokerage firms large and small started placing restrictions on trading. But in the interest of staying on good terms with the millions of “little guy” traders now trading at home, this situation was quickly corrected (well, at least to some degree) and GME rebounded a cool +68% on Friday. And as one might expect, today the stock is down about -30% as I type.
The stories of money made during this period are mind bending. I know one young man who made $27,000 on his $2,000 investment – last week. And there are no shortage of stories that are likely to become legendary for those r/wallstreetbets folks who played this game with options.
The question of the day – especially among those unhip, meme-challenged, gray-haired traditional portfolio managers – is whether we are witnessing a Reddit Revolution in investing, or just the latest in a long string of bubbles. Most of which didn’t end well.
The meme-trader crowd contends that GME is here to stay as they are simply willing the company up from the brink of bankruptcy. Wall Street hedge fund such as Melvin Capital (and by association, the mighty Citadel and Steve Cohen’s Point 72) had shorted the youngin’s Gamestop, assuming that Chapter 11 (or worse) was right around the corner.
But that was before what some are calling Occupy Wall Street 2.0 began. Once the millions of r/wallstreetbets followers took up the mantle, it was a brand-new game. A company that looked like it was about to fold was suddenly worth $22.6 billion (source: YCharts.com) as of Friday’s close. For the record, GME’s market cap was $1.31 on New Year’s eve. And by comparison, Best Buy (BBY) currently has a market cap of $27.4 billion.
Insane, right?
Even a Reddit newbie like me can understand that $GME ONLY, $NEVER SELL, etc., suggests that they want to hold this stock forever. Dreams of GME becoming the next Tesla likely abound.
However, I’ll contend that the move in GME isn’t completely controlled by the “little guys” as evidenced by a review of the trading tape. Very large block trades suggest that the hedgies themselves are in on the game. And one thing to know about the “fast money” is they like to take profits when they have them.
Then there is the concept that GME is a no-brainer short – as long as one has staying power to withstand the next attack from the meme-trader community. And with moves of -34% like we’re seeing this morning, you can rest assured that some shorts are making money here.
I think the key point here is no matter what the mania is, whether it be tulip-bulbs, web startups in 1999, or houses in 2006, all bubbles tend to burst at some point. You just never know when.
To any young meme-traders that may be out there reading this missive, yes, I get that you view this as an “us against them” or a David vs. Goliath situation here. But the bottom line is there just isn’t enough of you to keep GME elevated at “ridonkulous” levels for the long term.
What I’m trying to say is the GME move simply isn’t sustainable (and yes, you can place this statement in the “Duh!” category). And to be clear, this is NOT investing. It’s gambling on crowd behavior. So, if you are buying GME, please understand that the game could easily end in tears.
However, I DO recognize that the millions of r/wsb’ers and the like out there ARE indeed powerful enough to push almost anything to the moon – for a spell. For example, silver appears to be one the latest target of the meme-trading mob.
From my seat, I see this phenomena as a new momentum trading herd that is likely to stick around a while. Perhaps even longer than their beloved Gamestop!
Now let’s turn to the state of my favorite big-picture market models…
The Big-Picture Market Models
There are no changes to report on the Primary Cycle board this week. Given that five out of six models remain green, I believe it is best to continue to give the bulls the benefit of the doubt.
* Source: Ned Davis Research (NDR) as of the date of publication. Historical returns are hypothetical average annual performances calculated by NDR.
Fundamental Factor Models
There are no changes to the Fundamental board this week. However, as I have been saying for a few weeks now, I think it is important to recognize that there are no buy signals on the board, which tells me that risk is elevated.
* Source: Ned Davis Research (NDR) as of the date of publication. Historical returns are hypothetical average annual performances calculated by NDR.
“Primary” Cycle History
I have found that checking in on state of the cycles and the weekly/monthly charts helps to keep the big-picture in perspective.
* Source: Ned Davis Research (NDR) as of the date of publication. Historical returns are hypothetical average annual performances calculated by NDR.
The Secular Market Cycle
Below is a monthly chart of the S&P 500 Index illustrating the current cycle, which we estimate began on March 9, 2009.
S&P 500 – Monthly

View Full Size Chart Online
The Cyclical Market Cycle
Below is a weekly chart of the S&P 500 illustrating the current cycle, which we estimate began on March 24, 2020.
S&P 500 – Weekly

View Full Size Chart Online
Thought for the Day:
Socialism works until you run out of other people’s money. -Margaret Thatcher
Market Models Explained
Wishing you green screens and all the best for a great day,
David D. Moenning
Director Institutional Consulting
Capital Advisors 360, LLC
Disclosures
At the time of publication, Mr. Moenning held long positions in the following securities mentioned:
none
– Note that positions may change at any time.
NOT INDIVIDUAL INVESTMENT ADVICE. IMPORTANT FURTHER DISCLOSURES
Tags: David Moenning, State of the Markets, Stock Market, Stocks, Stock Market Commentary, Stock Market Analysis, Investing, Gamestop, Reddit, r/wallstreetbets
RECENT ARTICLES
The Time Has Come
The Market Panic Playbook
Bears Get Back In The Game
Sell in May, Except…
When Being Completely Wrong Works Out
Stronger For Longer?
Archives
Archives