Despite surprisingly good data on Retail Sales, stocks of all styles, sizes, and shapes took a hit on Friday. Semis, banks, smallcaps, midcaps, and large caps – all down. Value – down. Cyclicals – down. Growth – also down. Save the traditional risk-off sectors such as healthcare, staples, and utilities, there was nowhere to hide.
While the percentage declines weren’t overly harsh, the breadth of the pullback was a little out of the character for this market. Lately, the action has tended to favor either the reopening trade or the steady growth gang. Usually, one of these trades is a relative winner while the other takes its turn in the barrel. But on Friday, neither trade worked as both fell more than the S&P 500 itself.
While one can never be completely sure why things happen the way they do in Ms. Market’s game, the worry on Friday was that we’ve seen the peak in, well, everything.
As in GDP Growth. Fiscal stimulus. Monetary stimulus. Housing. Used car prices. Employment growth. Corporate profits. And to hear the bears tell it, there is only one way to go from here – down.
While this thesis may or may not be true, it certainly took hold late last week and traders embraced the idea that it was time for a change in the trend of both stock and bond prices.
To be sure, it was probably time for the markets to go the other way – at least for a while. After all, this does tend to be a two-steps-forward and one-step-back type of game. So, with stock indices having become overbought and sentiment overly optimistic/complacent, a pullback was to be expected at some point. All that was required was some sort of catalyst – such as a change in the narrative.
Apparently, the new narrative is “peak everything” – and that’s bad. Never mind the fact according to reports I’ve seen; the stock market often moves higher for quite some time after economic growth peaks. This makes sense as Corporate America is quite adept at generating earnings growth during expansionary environments – even after the best of times have occurred.
I think it’s also worth pointing out that some of the peaks we’re seeing should be considered positives. As in the likely peak level of inflation. And lumber. Oil. Used cars. Housing. And perhaps, bond yields.
As we’ve been discussing for some time now, the recent rates of ascent in these areas were simply unsustainable. This was due, of course, to the “year-over-year” comparisons from the pandemic-induced economic shutdown. And with the rapid reopening of the economy that ensued, it makes sense that the “peaks” in many areas are likely being seen now.
However, unlike past economic cycles, these “peaks” are more about comparisons to a closed economy, the ultimate rebound, and then the associated problems with that reopening – such as the supply chain issues, shortages, pent-up demand, etc.
My point is that the current peaks are, to a certain degree, artificial. As such, “peak everything” doesn’t suggest an actual slowdown in economic activity or earnings, but rather the mathematic reality of the current cycle.
From my perch, the key going forward will be the rate of growth the economy experiences and, in turn, corporate profits. As long as the economy can continue growing at a healthy clip (as in, higher than pre-pandemic levels), then the current “peaks” aren’t likely to be a threat to the stock market. However, given the current state of valuations, which many will argue have already priced in a healthy amount of growth, should growth disappoint (or inflation continue to surprise to the upside for longer than Powell & Company expect), then the bears could certainly take control of the game.
So for now, my plan is to pay particularly close attention to the upcoming economic data and to listen to the “forward guidance” companies provide on their earnings calls. Another way to think about this is the game will be about the “new normal” growth rates. In short, my thinking is the outlook for the future is a lot more important than the idea of “peak everything.”
Here’s hoping you have a great week. Now let’s review our indicator boards…
The Big-Picture Market Models
We start with six of our favorite long-term market models. These models are designed to help determine the “state” of the overall market.
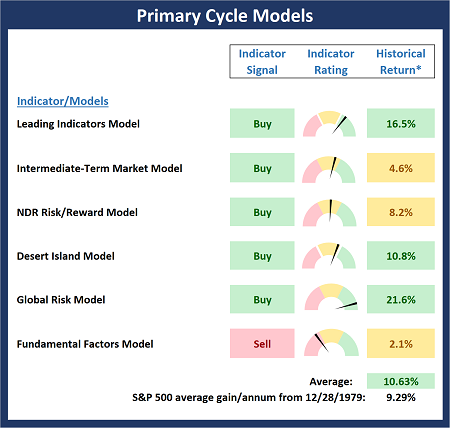
* Source: Ned Davis Research (NDR) as of the date of publication. Historical returns are hypothetical average annual performances calculated by NDR.
The Fundamental Backdrop
Next, we review the market’s fundamental factors including interest rates, the economy, earnings, inflation, and valuations.
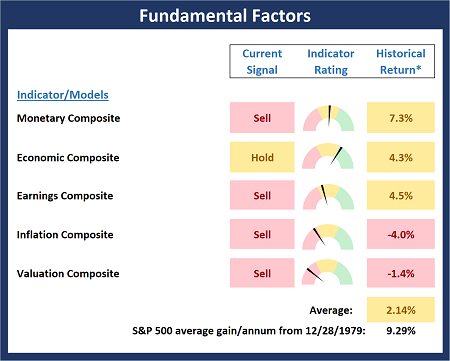
* Source: Ned Davis Research (NDR) as of the date of publication. Historical returns are hypothetical average annual performances calculated by NDR.
The State of the Trend
After reviewing the big-picture models and the fundamental backdrop, I like to look at the state of the current trend. This board of indicators is designed to tell us about the overall technical health of the market’s trend.
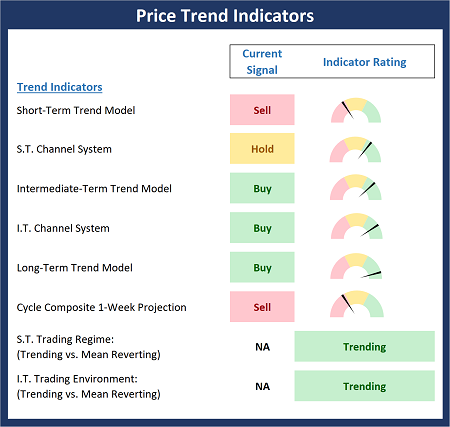
The State of Internal Momentum
Next, we analyze the momentum indicators/models to determine if there is any “oomph” behind the current move.
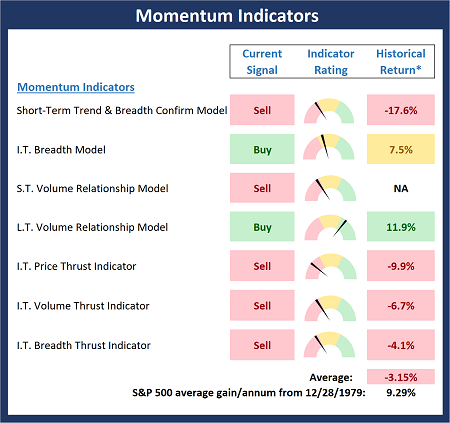
* Source: Ned Davis Research (NDR) as of the date of publication. Historical returns are hypothetical average annual performances calculated by NDR.
Early Warning Signals
Finally, we look at our early warning indicators to gauge the potential for counter-trend moves. This batch of indicators is designed to suggest when the table is set for the trend to “go the other way.”
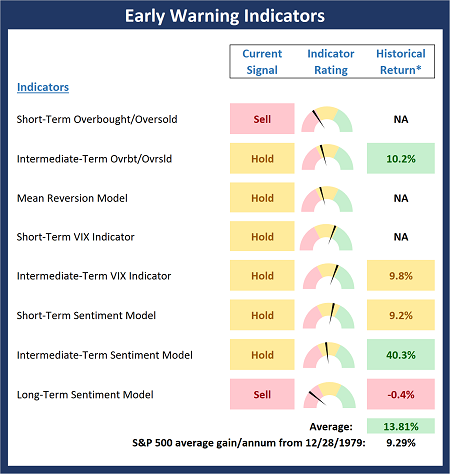
* Source: Ned Davis Research (NDR) as of the date of publication. Historical returns are hypothetical average annual performances calculated by NDR.
Thought for the Day:
My biggest drawdowns have always come after I have had a great period and I started to think that I knew something. -Paul Tudor Jones
Market Models Explained
Wishing you green screens and all the best for a great day,

David D. Moenning
Director Institutional Consulting
Capital Advisors 360, LLC

Disclosures
At the time of publication, Mr. Moenning held long positions in the following securities mentioned:
None
– Note that positions may change at any time.
NOT INDIVIDUAL INVESTMENT ADVICE. IMPORTANT FURTHER DISCLOSURES
Tags: David Moenning, State of the Markets, Stock Market, Stocks, Stock Market Commentary, Stock Market Analysis, Investing


Institutional Consulting
David Moenning
Is ‘Peak Everything’ A Problem?
Despite surprisingly good data on Retail Sales, stocks of all styles, sizes, and shapes took a hit on Friday. Semis, banks, smallcaps, midcaps, and large caps – all down. Value – down. Cyclicals – down. Growth – also down. Save the traditional risk-off sectors such as healthcare, staples, and utilities, there was nowhere to hide.
While the percentage declines weren’t overly harsh, the breadth of the pullback was a little out of the character for this market. Lately, the action has tended to favor either the reopening trade or the steady growth gang. Usually, one of these trades is a relative winner while the other takes its turn in the barrel. But on Friday, neither trade worked as both fell more than the S&P 500 itself.
While one can never be completely sure why things happen the way they do in Ms. Market’s game, the worry on Friday was that we’ve seen the peak in, well, everything.
As in GDP Growth. Fiscal stimulus. Monetary stimulus. Housing. Used car prices. Employment growth. Corporate profits. And to hear the bears tell it, there is only one way to go from here – down.
While this thesis may or may not be true, it certainly took hold late last week and traders embraced the idea that it was time for a change in the trend of both stock and bond prices.
To be sure, it was probably time for the markets to go the other way – at least for a while. After all, this does tend to be a two-steps-forward and one-step-back type of game. So, with stock indices having become overbought and sentiment overly optimistic/complacent, a pullback was to be expected at some point. All that was required was some sort of catalyst – such as a change in the narrative.
Apparently, the new narrative is “peak everything” – and that’s bad. Never mind the fact according to reports I’ve seen; the stock market often moves higher for quite some time after economic growth peaks. This makes sense as Corporate America is quite adept at generating earnings growth during expansionary environments – even after the best of times have occurred.
I think it’s also worth pointing out that some of the peaks we’re seeing should be considered positives. As in the likely peak level of inflation. And lumber. Oil. Used cars. Housing. And perhaps, bond yields.
As we’ve been discussing for some time now, the recent rates of ascent in these areas were simply unsustainable. This was due, of course, to the “year-over-year” comparisons from the pandemic-induced economic shutdown. And with the rapid reopening of the economy that ensued, it makes sense that the “peaks” in many areas are likely being seen now.
However, unlike past economic cycles, these “peaks” are more about comparisons to a closed economy, the ultimate rebound, and then the associated problems with that reopening – such as the supply chain issues, shortages, pent-up demand, etc.
My point is that the current peaks are, to a certain degree, artificial. As such, “peak everything” doesn’t suggest an actual slowdown in economic activity or earnings, but rather the mathematic reality of the current cycle.
From my perch, the key going forward will be the rate of growth the economy experiences and, in turn, corporate profits. As long as the economy can continue growing at a healthy clip (as in, higher than pre-pandemic levels), then the current “peaks” aren’t likely to be a threat to the stock market. However, given the current state of valuations, which many will argue have already priced in a healthy amount of growth, should growth disappoint (or inflation continue to surprise to the upside for longer than Powell & Company expect), then the bears could certainly take control of the game.
So for now, my plan is to pay particularly close attention to the upcoming economic data and to listen to the “forward guidance” companies provide on their earnings calls. Another way to think about this is the game will be about the “new normal” growth rates. In short, my thinking is the outlook for the future is a lot more important than the idea of “peak everything.”
Here’s hoping you have a great week. Now let’s review our indicator boards…
The Big-Picture Market Models
We start with six of our favorite long-term market models. These models are designed to help determine the “state” of the overall market.
* Source: Ned Davis Research (NDR) as of the date of publication. Historical returns are hypothetical average annual performances calculated by NDR.
The Fundamental Backdrop
Next, we review the market’s fundamental factors including interest rates, the economy, earnings, inflation, and valuations.
* Source: Ned Davis Research (NDR) as of the date of publication. Historical returns are hypothetical average annual performances calculated by NDR.
The State of the Trend
After reviewing the big-picture models and the fundamental backdrop, I like to look at the state of the current trend. This board of indicators is designed to tell us about the overall technical health of the market’s trend.
The State of Internal Momentum
Next, we analyze the momentum indicators/models to determine if there is any “oomph” behind the current move.
* Source: Ned Davis Research (NDR) as of the date of publication. Historical returns are hypothetical average annual performances calculated by NDR.
Early Warning Signals
Finally, we look at our early warning indicators to gauge the potential for counter-trend moves. This batch of indicators is designed to suggest when the table is set for the trend to “go the other way.”
* Source: Ned Davis Research (NDR) as of the date of publication. Historical returns are hypothetical average annual performances calculated by NDR.
Thought for the Day:
My biggest drawdowns have always come after I have had a great period and I started to think that I knew something. -Paul Tudor Jones
Market Models Explained
Wishing you green screens and all the best for a great day,
David D. Moenning
Director Institutional Consulting
Capital Advisors 360, LLC
Disclosures
At the time of publication, Mr. Moenning held long positions in the following securities mentioned:
None
– Note that positions may change at any time.
NOT INDIVIDUAL INVESTMENT ADVICE. IMPORTANT FURTHER DISCLOSURES
Tags: David Moenning, State of the Markets, Stock Market, Stocks, Stock Market Commentary, Stock Market Analysis, Investing
RECENT ARTICLES
The Time Has Come
The Market Panic Playbook
Bears Get Back In The Game
Sell in May, Except…
When Being Completely Wrong Works Out
Stronger For Longer?
Archives
Archives