The State of the Market: Executive Summary
Well, so much for that bullish cup-with-a-handle formation that appeared to be developing on the charts. As I had opined earlier in the week, if the S&P broke above the “handle” of the formation, a new uptrend had a chance. But the flipside was if the recent low levels didn’t hold, then some downside testing would likely ensue. And some downside testing is exactly what we’ve got this morning as traders attempt to find an equilibrium point for the current state of the virus and the accompanying damage expected to be inflicted on the economies of the world.
From a big-picture standpoint, the backstop for the decline is clearly the Fed and the next round of economic stimulus. However, from a shorter-term perspective, election uncertainty and the targeted lockdowns that are starting to go into effect are the focus. Thus, traders are selling on the fear that the surge in cases will slow the economic recovery. As such, prices need to be adjusted a bit. This is what a correction is all about – especially when “the narrative” changes.
For me, the big question of the day is if the COVID Trade is back in business and correspondingly, if all those cyclical/value plays will be abandoned (or at the very least, put on the back burner for a while). Now that the COVID winners have cooled off a bit (see the charts of FB, AAPL, AMZN, NFLX, GOOGL, MSFT, etc.) I can argue that traders might want to return to the names that became “safe havens” during the initial stages of the pandemic. The thinking here was that you wanted to own those names that would be able to grow during an economic slowdown. Made sense to me.
But then the “trade” got overdone as everybody piled into the same names. This caused the value players to jump up and down about “bubbles” in the megacap tech space and the opportunity in cyclicals, financials, etc. And as the economic recovery unfolded, the rotation to the cyclicals also made some sense. But with the virus now surging around the globe, it will be interesting to see if traders abandon this theme.
Currently, there is selling across the board and the market has a “risk off” feel to it. This too makes some sense. But I’ll be watching closely to see if traders don their hard hats and head to the sidelines – or if they start to move back into the COVID Winners sometime in the near future. For me, this holds the key to the near-term.
Now let’s take a look at what our Early Warning indicator board tells us about the near-term outlook…
The State of the “Early Warning” Indicators
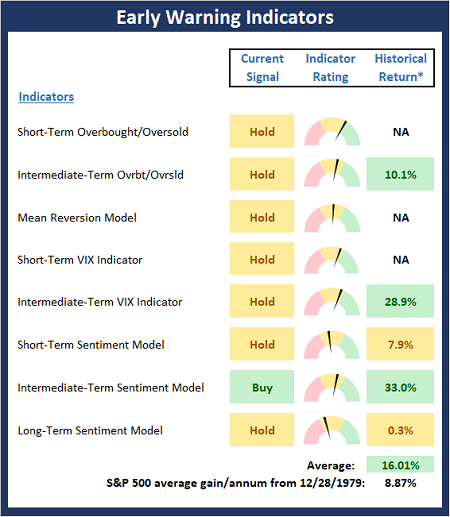
The predominant color of the Early Warning board suggests that things remains neutral here from an “early warning” or mean reversion standpoint. However, if you look closely at the gauges, which show the current readings of the various indicators, you will see that the majority of our early warning indicators are closing in on positive readings. So, my takeaway here is that we’re currently in a “get ready to go the other way” state. But as was famously said in the classic movie Trading Places, my take is, “not yet.”

* Source: Ned Davis Research (NDR) as of the date of publication.
Stochastic Review
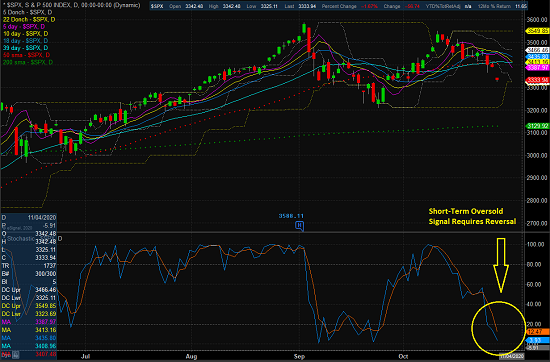
As you can see on the chart below, the stochastics are now in oversold territory. This is a good thing from a mean-reversion perspective. However, the key thing to understand about mean reversion is that reaching an oversold condition is merely step one. In order for the market to “go the other way,” you need to then see a reversal. For example, in September, the market got oversold and stayed there for a while. Then, the stochastic finally reversed, breaking above its previous high. The way I play the game, THIS is when an oversold signal occurs. And to be clear, playing this game is more art than science. For example, the current oversold condition is being driven by the news on the virus. As such, easing of virus fears will likely be the trigger for the next move higher – and not some technical, oversold condition.
S&P 500 – Daily

View Large Chart Online
Thought For The Day:
The true measure of an individual is how he treats a person who can do him absolutely no good. – Ann Landers
Wishing you green screens and all the best for a great day,

David D. Moenning
Director of Institutional Consulting
Capital Advisors 360, LLC

*Explanations & Disclosures: Educational purposes only – not individual investment advice. Historical returns are hypothetical average annual performances calculated by NDR. Past performances do not guarantee future results or profitability. At the time of publication, Mr. Moenning held long positions in the following securities mentioned: FB, AAPL, AMZN, NFLX, MSFT – please note that these positions may change at any time. Please click here for further important State of the Market model explanations and disclaimers.


Institutional Consulting
David Moenning
Is It Time to Return to the COVID Winners?
The State of the Market: Executive Summary
Well, so much for that bullish cup-with-a-handle formation that appeared to be developing on the charts. As I had opined earlier in the week, if the S&P broke above the “handle” of the formation, a new uptrend had a chance. But the flipside was if the recent low levels didn’t hold, then some downside testing would likely ensue. And some downside testing is exactly what we’ve got this morning as traders attempt to find an equilibrium point for the current state of the virus and the accompanying damage expected to be inflicted on the economies of the world.
From a big-picture standpoint, the backstop for the decline is clearly the Fed and the next round of economic stimulus. However, from a shorter-term perspective, election uncertainty and the targeted lockdowns that are starting to go into effect are the focus. Thus, traders are selling on the fear that the surge in cases will slow the economic recovery. As such, prices need to be adjusted a bit. This is what a correction is all about – especially when “the narrative” changes.
For me, the big question of the day is if the COVID Trade is back in business and correspondingly, if all those cyclical/value plays will be abandoned (or at the very least, put on the back burner for a while). Now that the COVID winners have cooled off a bit (see the charts of FB, AAPL, AMZN, NFLX, GOOGL, MSFT, etc.) I can argue that traders might want to return to the names that became “safe havens” during the initial stages of the pandemic. The thinking here was that you wanted to own those names that would be able to grow during an economic slowdown. Made sense to me.
But then the “trade” got overdone as everybody piled into the same names. This caused the value players to jump up and down about “bubbles” in the megacap tech space and the opportunity in cyclicals, financials, etc. And as the economic recovery unfolded, the rotation to the cyclicals also made some sense. But with the virus now surging around the globe, it will be interesting to see if traders abandon this theme.
Currently, there is selling across the board and the market has a “risk off” feel to it. This too makes some sense. But I’ll be watching closely to see if traders don their hard hats and head to the sidelines – or if they start to move back into the COVID Winners sometime in the near future. For me, this holds the key to the near-term.
Now let’s take a look at what our Early Warning indicator board tells us about the near-term outlook…
The State of the “Early Warning” Indicators
The predominant color of the Early Warning board suggests that things remains neutral here from an “early warning” or mean reversion standpoint. However, if you look closely at the gauges, which show the current readings of the various indicators, you will see that the majority of our early warning indicators are closing in on positive readings. So, my takeaway here is that we’re currently in a “get ready to go the other way” state. But as was famously said in the classic movie Trading Places, my take is, “not yet.”
* Source: Ned Davis Research (NDR) as of the date of publication.
Stochastic Review
As you can see on the chart below, the stochastics are now in oversold territory. This is a good thing from a mean-reversion perspective. However, the key thing to understand about mean reversion is that reaching an oversold condition is merely step one. In order for the market to “go the other way,” you need to then see a reversal. For example, in September, the market got oversold and stayed there for a while. Then, the stochastic finally reversed, breaking above its previous high. The way I play the game, THIS is when an oversold signal occurs. And to be clear, playing this game is more art than science. For example, the current oversold condition is being driven by the news on the virus. As such, easing of virus fears will likely be the trigger for the next move higher – and not some technical, oversold condition.
S&P 500 – Daily

View Large Chart Online
Thought For The Day:
The true measure of an individual is how he treats a person who can do him absolutely no good. – Ann Landers
Wishing you green screens and all the best for a great day,
David D. Moenning
Director of Institutional Consulting
Capital Advisors 360, LLC
*Explanations & Disclosures: Educational purposes only – not individual investment advice. Historical returns are hypothetical average annual performances calculated by NDR. Past performances do not guarantee future results or profitability. At the time of publication, Mr. Moenning held long positions in the following securities mentioned: FB, AAPL, AMZN, NFLX, MSFT – please note that these positions may change at any time. Please click here for further important State of the Market model explanations and disclaimers.
RECENT ARTICLES
The Time Has Come
The Market Panic Playbook
Bears Get Back In The Game
Sell in May, Except…
When Being Completely Wrong Works Out
Stronger For Longer?
Archives
Archives