Good morning, and Happy “Twosday.” As in 2/22/22, which is not only a palindrome because it reads the same forward as backwards, but today’s date also consists of all the same digits. The ultimate freakiness for such dates occurs at 2:22 am and pm, so brace yourself for that this afternoon. Oh, and according to the National Weather Service, this sort of “Twosday” won’t happen again for another 400 years.
Given that we had a holiday weekend, I was tempted to pen my weekly missive early this week. However, I had a sneaking suspicion that Russia might take some action, leaving my oftentimes meandering market musings moot. I had been keeping an eye on the calendar as historically the Olympics have been a time of truce for countries engaged in military conflicts.
As suspected, the very next day after the Olympic closing ceremonies, Putin & Co. made a move.
It wasn’t a big move. There was no outright Russian invasion of Ukraine. There were no airstrikes. No tanks or troops streaming across the border. No pronouncement that Mother Russia was bringing Ukraine home. Nope, this looks more like the first move on the geopolitical chess board.
But make no mistake, it was definitely a move. A move that would appear to signal that whatever is to come next has definitely begun. So, it’s game on. Specifically, Putin officially recognized the Donetsk and Luhansk regions, which are in eastern Ukraine. Note that these are two Moscow-backed separatist-controlled areas that are attempting to claim independence from Ukraine. By the way, this situation has been ongoing since 2014.
In response to Putin’s move, the U.S. and UK have announced targeted sanctions on certain banks and wealthy individuals. The allies really can’t do much more at this point because Putin has long kept “peace keeping” troops (insert LOL emoji here) in the region and technically hasn’t taken any real action.
As you might expect, stocks tanked in Russia on the news. Asian equities opened lower. Things weren’t looking good in the early going for Europe’s open. And U.S. futures were pointing last night to an opening loss of -1.5% to 2.5%, depending on which index flavor you prefer.
But since then, cooler heads appear to have prevailed. Yes, it as a down day in Asia, but not terribly so. European equities didn’t crater as both the FTSE and STOXX are actually up as I type this morning. And stocks here in the good ‘ol USofA have opened only modestly lower.
And my $0.02 is U.S. indices are more likely being affected by some fresh Fedspeak out just before the open. Comments that appear to support a 0.50% rate hike in March.
The Question of the Day
Although there are an awful lot of moving parts at the present time, for me, the question of the day is if we are closing in on the end to a garden-variety correction or the start of a more prolonged, cyclical bear market?
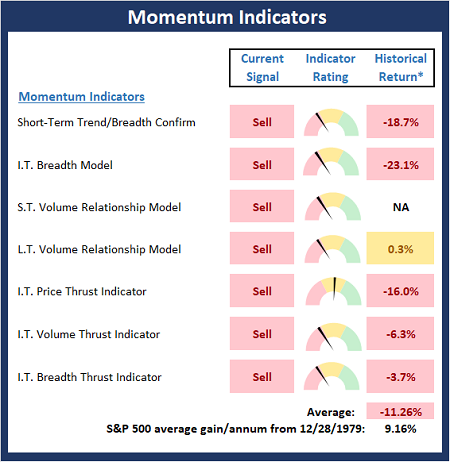
To anyone watching the market’s internals, it is clear that there has been a change in the market’s character in recent months. One look at my Momentum Board below really tells the story here as we haven’t seen that much red on the board since the COVID Crash.
From a macro point of view, this market has multiple issues to deal with. There is the Fed’s pivot from friend to foe – and just how antagonistic Powell & Co plan to be is a matter of debate in the markets. There is the inflation issue, as prices have remained much higher and for much longer than had been expected. There is the fact that the rate of corporate profit growth is now moving lower (which, of course, was to be expected after last year’s reopening surge). And then there is the not-so-pleasant valuation reset for a great many of the super-high growth areas, especially anything considered “spectech.”
I’ve been saying for some time that while it may be true that the rate of earnings growth is slowing (mathematically, it has to), as long as earnings expectations are moving up to the right, there is room for stocks to move on up as well. So, it is encouraging to note that according to Bespoke Investment Group, the S&P 500 does indeed tend to move higher when earnings expectations are at record highs – as they are now.
So which is it? A cyclical bear (that would be occurring within the context of the secular bull market cycle that began on 3/9/2009) due to the adjustments traders deem necessary in view of higher rates and inflation. Or are we seeing a correction based on the macro issues and the “bad news panic” relating to geopolitics?
On the geopolitical front, history suggests that regardless of the degree/outcome of Putin’s current moves, the markets are likely to move on in relatively short order. We’ve seen this movie before. If you believe WW III is about to begin, then by all means, don the helmet and take cover. But if you see this situation as political gamesmanship which does not threaten economic growth, it is probably best to start consulting your shopping list for names to add to your portfolio.
Lest we forget, the S&P 500 is now down 10% year-to-date and history shows that such declines are fairly common. However, what is far less uncommon, is for the venerable blue chip index to be down this amount for a full calendar year. This is especially true when there is no threat of recession, which, from my seat, looks very unlikely at this stage of the game.
It’s also worth noting that we’ve already seen a Tech-Bubble-like decline in many of the speculative tech areas (think the ARKK names). And according to CNBC’s Michael Santolli, approximately one-third of the Nasdaq 100 Index components are off at least 30% from their highs. While about half of the S&P’s names are down 15% or more from their recent highs. As such, one can argue that we can make a checkmark next to the correction category requirements.
The bottom line – for me, anyway – from a big-picture, what type of market are we dealing with, standpoint, is to watch the lows seen last fall. My take is that the 4250-4300 zone for the S&P 500 is important territory. If any Russia-induced (or anything else that crops up, for that matter) downside volatility creates a test of this zone, I will view the results of the test to be the determining factor in trying to answer our question of the day.
So, the combination of no recession and record earnings suggests to me that this is corrective phase where the frothiest names are seeing a valuation reset and folks are rethinking their views on multiples given the shifting macro landscape. But should the Fed become too antagonistic, or growth become threatened, then the bears may have a case. But for now, I’m looking at this as a market experiencing a not-so unusual corrective phase. Time will tell.
Now let’s review the “state of the market” through the lens of our market models…
The Big-Picture Market Models
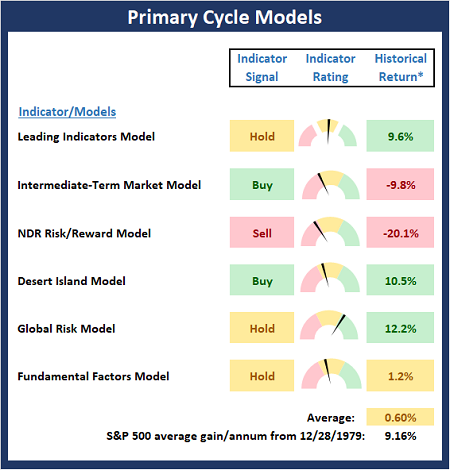
We start with six of our favorite long-term market models. These models are designed to help determine the “state” of the overall market.
* Source: Ned Davis Research (NDR) as of the date of publication. Historical returns are hypothetical average annual performances calculated by NDR.
The Fundamental Backdrop
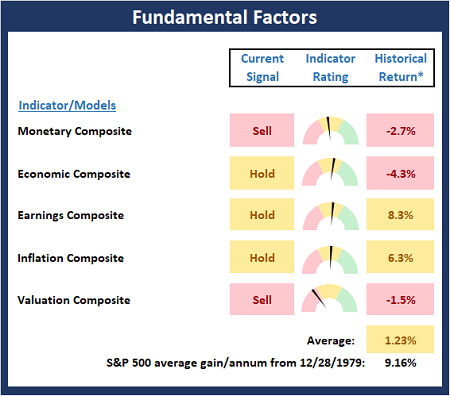
Next, we review the market’s fundamental factors including interest rates, the economy, earnings, inflation, and valuations.
* Source: Ned Davis Research (NDR) as of the date of publication. Historical returns are hypothetical average annual performances calculated by NDR.
The State of the Trend
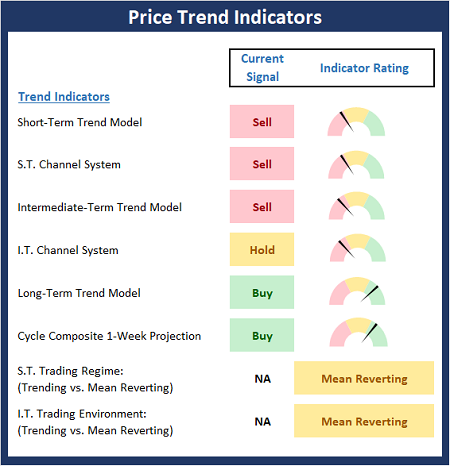
After reviewing the big-picture models and the fundamental backdrop, I like to look at the state of the current trend. This board of indicators is designed to tell us about the overall technical health of the market’s trend.
The State of Internal Momentum
Next, we analyze the momentum indicators/models to determine if there is any “oomph” behind the current move.
* Source: Ned Davis Research (NDR) as of the date of publication. Historical returns are hypothetical average annual performances calculated by NDR.
Early Warning Indicators
Finally, we look at our early warning indicators to gauge the potential for countertrend moves. This batch of indicators is designed to suggest when the table is set for the trend to “go the other way.”
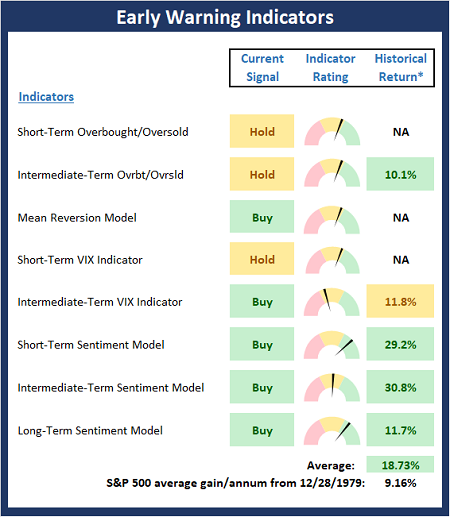
* Source: Ned Davis Research (NDR) as of the date of publication. Historical returns are hypothetical average annual performances calculated by NDR.
Thought for the Day:
“He who asks is a fool for five minutes, but he who does not ask remains a fool forever.” – Chinese Proverb
Market Models Explained
Wishing you green screens and all the best for a great day,

David D. Moenning
Director Institutional Consulting
Capital Advisors 360, LLC

Disclosures
At the time of publication, Mr. Moenning held long positions in the following securities mentioned:
None
– Note that positions may change at any time.
NOT INDIVIDUAL INVESTMENT ADVICE. IMPORTANT FURTHER DISCLOSURES
Tags: David Moenning, State of the Markets, Stock Market, Stocks, Stock Market Commentary, Stock Market Analysis, Investing


Institutional Consulting
David Moenning
Happy Twosday
Good morning, and Happy “Twosday.” As in 2/22/22, which is not only a palindrome because it reads the same forward as backwards, but today’s date also consists of all the same digits. The ultimate freakiness for such dates occurs at 2:22 am and pm, so brace yourself for that this afternoon. Oh, and according to the National Weather Service, this sort of “Twosday” won’t happen again for another 400 years.
Given that we had a holiday weekend, I was tempted to pen my weekly missive early this week. However, I had a sneaking suspicion that Russia might take some action, leaving my oftentimes meandering market musings moot. I had been keeping an eye on the calendar as historically the Olympics have been a time of truce for countries engaged in military conflicts.
As suspected, the very next day after the Olympic closing ceremonies, Putin & Co. made a move.
It wasn’t a big move. There was no outright Russian invasion of Ukraine. There were no airstrikes. No tanks or troops streaming across the border. No pronouncement that Mother Russia was bringing Ukraine home. Nope, this looks more like the first move on the geopolitical chess board.
But make no mistake, it was definitely a move. A move that would appear to signal that whatever is to come next has definitely begun. So, it’s game on. Specifically, Putin officially recognized the Donetsk and Luhansk regions, which are in eastern Ukraine. Note that these are two Moscow-backed separatist-controlled areas that are attempting to claim independence from Ukraine. By the way, this situation has been ongoing since 2014.
In response to Putin’s move, the U.S. and UK have announced targeted sanctions on certain banks and wealthy individuals. The allies really can’t do much more at this point because Putin has long kept “peace keeping” troops (insert LOL emoji here) in the region and technically hasn’t taken any real action.
As you might expect, stocks tanked in Russia on the news. Asian equities opened lower. Things weren’t looking good in the early going for Europe’s open. And U.S. futures were pointing last night to an opening loss of -1.5% to 2.5%, depending on which index flavor you prefer.
But since then, cooler heads appear to have prevailed. Yes, it as a down day in Asia, but not terribly so. European equities didn’t crater as both the FTSE and STOXX are actually up as I type this morning. And stocks here in the good ‘ol USofA have opened only modestly lower.
And my $0.02 is U.S. indices are more likely being affected by some fresh Fedspeak out just before the open. Comments that appear to support a 0.50% rate hike in March.
The Question of the Day
Although there are an awful lot of moving parts at the present time, for me, the question of the day is if we are closing in on the end to a garden-variety correction or the start of a more prolonged, cyclical bear market?
To anyone watching the market’s internals, it is clear that there has been a change in the market’s character in recent months. One look at my Momentum Board below really tells the story here as we haven’t seen that much red on the board since the COVID Crash.
From a macro point of view, this market has multiple issues to deal with. There is the Fed’s pivot from friend to foe – and just how antagonistic Powell & Co plan to be is a matter of debate in the markets. There is the inflation issue, as prices have remained much higher and for much longer than had been expected. There is the fact that the rate of corporate profit growth is now moving lower (which, of course, was to be expected after last year’s reopening surge). And then there is the not-so-pleasant valuation reset for a great many of the super-high growth areas, especially anything considered “spectech.”
I’ve been saying for some time that while it may be true that the rate of earnings growth is slowing (mathematically, it has to), as long as earnings expectations are moving up to the right, there is room for stocks to move on up as well. So, it is encouraging to note that according to Bespoke Investment Group, the S&P 500 does indeed tend to move higher when earnings expectations are at record highs – as they are now.
So which is it? A cyclical bear (that would be occurring within the context of the secular bull market cycle that began on 3/9/2009) due to the adjustments traders deem necessary in view of higher rates and inflation. Or are we seeing a correction based on the macro issues and the “bad news panic” relating to geopolitics?
On the geopolitical front, history suggests that regardless of the degree/outcome of Putin’s current moves, the markets are likely to move on in relatively short order. We’ve seen this movie before. If you believe WW III is about to begin, then by all means, don the helmet and take cover. But if you see this situation as political gamesmanship which does not threaten economic growth, it is probably best to start consulting your shopping list for names to add to your portfolio.
Lest we forget, the S&P 500 is now down 10% year-to-date and history shows that such declines are fairly common. However, what is far less uncommon, is for the venerable blue chip index to be down this amount for a full calendar year. This is especially true when there is no threat of recession, which, from my seat, looks very unlikely at this stage of the game.
It’s also worth noting that we’ve already seen a Tech-Bubble-like decline in many of the speculative tech areas (think the ARKK names). And according to CNBC’s Michael Santolli, approximately one-third of the Nasdaq 100 Index components are off at least 30% from their highs. While about half of the S&P’s names are down 15% or more from their recent highs. As such, one can argue that we can make a checkmark next to the correction category requirements.
The bottom line – for me, anyway – from a big-picture, what type of market are we dealing with, standpoint, is to watch the lows seen last fall. My take is that the 4250-4300 zone for the S&P 500 is important territory. If any Russia-induced (or anything else that crops up, for that matter) downside volatility creates a test of this zone, I will view the results of the test to be the determining factor in trying to answer our question of the day.
So, the combination of no recession and record earnings suggests to me that this is corrective phase where the frothiest names are seeing a valuation reset and folks are rethinking their views on multiples given the shifting macro landscape. But should the Fed become too antagonistic, or growth become threatened, then the bears may have a case. But for now, I’m looking at this as a market experiencing a not-so unusual corrective phase. Time will tell.
Now let’s review the “state of the market” through the lens of our market models…
The Big-Picture Market Models
We start with six of our favorite long-term market models. These models are designed to help determine the “state” of the overall market.
* Source: Ned Davis Research (NDR) as of the date of publication. Historical returns are hypothetical average annual performances calculated by NDR.
The Fundamental Backdrop
Next, we review the market’s fundamental factors including interest rates, the economy, earnings, inflation, and valuations.
* Source: Ned Davis Research (NDR) as of the date of publication. Historical returns are hypothetical average annual performances calculated by NDR.
The State of the Trend
After reviewing the big-picture models and the fundamental backdrop, I like to look at the state of the current trend. This board of indicators is designed to tell us about the overall technical health of the market’s trend.
The State of Internal Momentum
Next, we analyze the momentum indicators/models to determine if there is any “oomph” behind the current move.
* Source: Ned Davis Research (NDR) as of the date of publication. Historical returns are hypothetical average annual performances calculated by NDR.
Early Warning Indicators
Finally, we look at our early warning indicators to gauge the potential for countertrend moves. This batch of indicators is designed to suggest when the table is set for the trend to “go the other way.”
* Source: Ned Davis Research (NDR) as of the date of publication. Historical returns are hypothetical average annual performances calculated by NDR.
Thought for the Day:
“He who asks is a fool for five minutes, but he who does not ask remains a fool forever.” – Chinese Proverb
Market Models Explained
Wishing you green screens and all the best for a great day,
David D. Moenning
Director Institutional Consulting
Capital Advisors 360, LLC
Disclosures
At the time of publication, Mr. Moenning held long positions in the following securities mentioned:
None
– Note that positions may change at any time.
NOT INDIVIDUAL INVESTMENT ADVICE. IMPORTANT FURTHER DISCLOSURES
Tags: David Moenning, State of the Markets, Stock Market, Stocks, Stock Market Commentary, Stock Market Analysis, Investing
RECENT ARTICLES
The Time Has Come
The Market Panic Playbook
Bears Get Back In The Game
Sell in May, Except…
When Being Completely Wrong Works Out
Stronger For Longer?
Archives
Archives