Although stocks rallied to end the week and my screens are flashing a lot of green again this morning, it appears that the relentless rally that began in March (or some might argue, November 2020) has stalled a bit. To be sure, this isn’t the first time the bulls have taken a break during this stellar run. No, by my count, this is the fourth such respite since March and the sixth since last November. As such, there doesn’t seem to be much reason for alarm at this point.
Given that traders appear to have jumped on the mini decline that took place last week, our heroes in horns will argue the little pullback was a “pause that refreshes.” The thinking here is that traders are reassessing/rethinking the situation and are now rotating back to the “dependable growth” names. And since these megacap growers tend to dominate the major indices, onward and upward could be the new battle cry.
But one thing is for certain in this business – and that is, “all good things come to an end,” eventually. On that note, I’ve been asked several times in recent weeks what might cause the next real pullback or corrective phase. From my seat, the answer is pretty obvious: the Delta variant’s disruption of our long awaited “return to normalcy.”
Don’t look now fans but masks are back in vogue. Outdoor dining is once again the preferred option. Social gatherings are back on the deck instead of in the family room. In short, caution has returned. In more ways than one.
As last week’s report on Retail Sales detailed, consumers appear to be turning a bit cautious on spending. Sure, in the aggregate, Mr. and Mrs. John Q. Public have plenty of dough to spend. However, with the Delta variant spreading like wildfire here in the U.S. and even kids and vaccinated folks now catching it, the consumer knows what to do. Less. Less shopping. Less eating out. Less movies, gym visits, etcetera, etcetra.
Jerome Powell acknowledged the risk of the Delta variant (and any future mutations) to the economy last week. “As long as Covid is running loose out there, as long as there’s time and space for the development of new strains, no one’s really finally safe,” Powell opined.
Heck, even one of the most Hawkish Fed Presidents, Rob Kaplan (who heads up the Dallas Federal Reserve) said he might rethink his call for the Fed to quickly start tapering its $120 billion monthly bond purchases – if it looks like the spread of the coronavirus delta variant is slowing economic growth.
If you will recall, Kaplan was the first Fed official to start “talking taper,” way back in April. However, in an interview on Friday, he called the delta variant “the big imponderable.” Hmmm…
While I do NOT believe we will see 2020-style lockdowns and/or economic shutdowns, it is easy to see how the Delta variant could slow the economy’s roll here. The question, of course is, by how much – and for how long?
And yes, stocks will start to look beyond Delta’s impact at some point. This could even be starting now. But with the historical cycles pointing down hard in September, my thinking is some caution might be warranted here. At least for a while, anyway.
Lest we forget, stocks don’t always need a reason to pull back. As our furry friends remind us, garden variety pullbacks of 3-5% are quite common and don’t always require a catalyst. No, sometimes pullbacks happen, just because it’s time.
For example, according to Ned Davis Research Group, it’s been 67 days since the last 3% correction on the S&P 500, which is nearly 3X the average seen during the secular bull markets since early 1900. It is also worth noting that the S&P has gone 199 days without a 5% correction – and the average time in between such events has been 84 trading days. Oh, and just for the record, it’s been 354 days without either a 10% or 20% correction – while the averages are 331 and 1105 days respectively.
So, while traders appear to remain upbeat at the current time and one can argue that the Delta disruption will have minimal impact on corporate earnings, I for one, believe it is logical to maybe have some dry powder here. Call me crazy. Or chicken, if you must. But given that Wall Street has been a one-way street for quite some time, experience tells me to be ready for the next thing to come out of the woodwork at some point. It usually does.
Here’s hoping you have a great week. Now let’s review our indicator boards…
The Big-Picture Market Models
We start with six of our favorite long-term market models. These models are designed to help determine the “state” of the overall market.
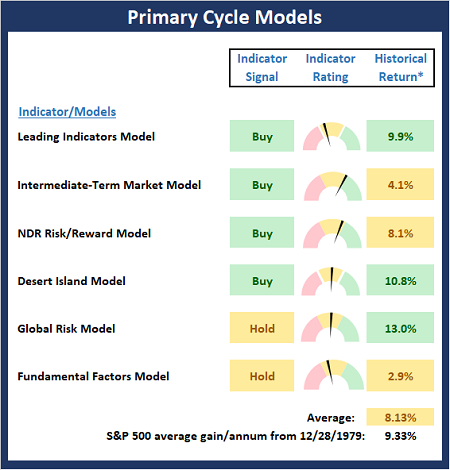
* Source: Ned Davis Research (NDR) as of the date of publication. Historical returns are hypothetical average annual performances calculated by NDR.
The Fundamental Backdrop
Next, we review the market’s fundamental factors including interest rates, the economy, earnings, inflation, and valuations.
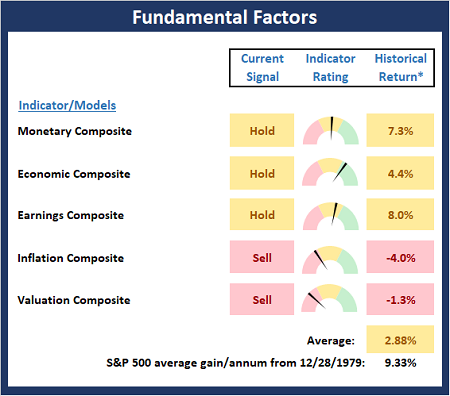
* Source: Ned Davis Research (NDR) as of the date of publication. Historical returns are hypothetical average annual performances calculated by NDR.
The State of the Trend
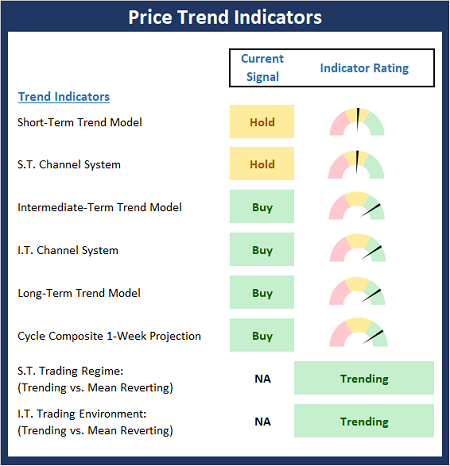
After reviewing the big-picture models and the fundamental backdrop, I like to look at the state of the current trend. This board of indicators is designed to tell us about the overall technical health of the market’s trend.
The State of Internal Momentum
Next, we analyze the momentum indicators/models to determine if there is any “oomph” behind the current move.
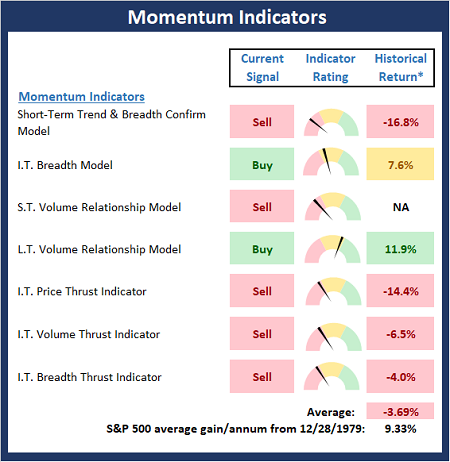
* Source: Ned Davis Research (NDR) as of the date of publication. Historical returns are hypothetical average annual performances calculated by NDR.
Early Warning Signals
Finally, we look at our early warning indicators to gauge the potential for counter-trend moves. This batch of indicators is designed to suggest when the table is set for the trend to “go the other way.”
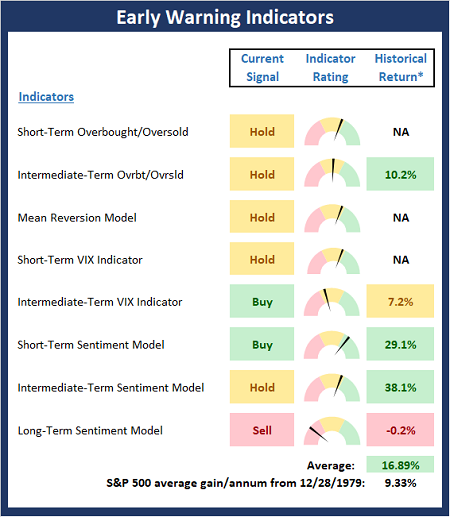
* Source: Ned Davis Research (NDR) as of the date of publication. Historical returns are hypothetical average annual performances calculated by NDR.
Thought for the Day:
Breathe. Believe. Battle. -Keri Walsh Jennings
Market Models Explained
Wishing you green screens and all the best for a great day,

David D. Moenning
Director Institutional Consulting
Capital Advisors 360, LLC

Disclosures
At the time of publication, Mr. Moenning held long positions in the following securities mentioned:
None
– Note that positions may change at any time.
NOT INDIVIDUAL INVESTMENT ADVICE. IMPORTANT FURTHER DISCLOSURES
Tags: David Moenning, State of the Markets, Stock Market, Stocks, Stock Market Commentary, Stock Market Analysis, Investing


Institutional Consulting
David Moenning
Delta Disruption?
Although stocks rallied to end the week and my screens are flashing a lot of green again this morning, it appears that the relentless rally that began in March (or some might argue, November 2020) has stalled a bit. To be sure, this isn’t the first time the bulls have taken a break during this stellar run. No, by my count, this is the fourth such respite since March and the sixth since last November. As such, there doesn’t seem to be much reason for alarm at this point.
Given that traders appear to have jumped on the mini decline that took place last week, our heroes in horns will argue the little pullback was a “pause that refreshes.” The thinking here is that traders are reassessing/rethinking the situation and are now rotating back to the “dependable growth” names. And since these megacap growers tend to dominate the major indices, onward and upward could be the new battle cry.
But one thing is for certain in this business – and that is, “all good things come to an end,” eventually. On that note, I’ve been asked several times in recent weeks what might cause the next real pullback or corrective phase. From my seat, the answer is pretty obvious: the Delta variant’s disruption of our long awaited “return to normalcy.”
Don’t look now fans but masks are back in vogue. Outdoor dining is once again the preferred option. Social gatherings are back on the deck instead of in the family room. In short, caution has returned. In more ways than one.
As last week’s report on Retail Sales detailed, consumers appear to be turning a bit cautious on spending. Sure, in the aggregate, Mr. and Mrs. John Q. Public have plenty of dough to spend. However, with the Delta variant spreading like wildfire here in the U.S. and even kids and vaccinated folks now catching it, the consumer knows what to do. Less. Less shopping. Less eating out. Less movies, gym visits, etcetera, etcetra.
Jerome Powell acknowledged the risk of the Delta variant (and any future mutations) to the economy last week. “As long as Covid is running loose out there, as long as there’s time and space for the development of new strains, no one’s really finally safe,” Powell opined.
Heck, even one of the most Hawkish Fed Presidents, Rob Kaplan (who heads up the Dallas Federal Reserve) said he might rethink his call for the Fed to quickly start tapering its $120 billion monthly bond purchases – if it looks like the spread of the coronavirus delta variant is slowing economic growth.
If you will recall, Kaplan was the first Fed official to start “talking taper,” way back in April. However, in an interview on Friday, he called the delta variant “the big imponderable.” Hmmm…
While I do NOT believe we will see 2020-style lockdowns and/or economic shutdowns, it is easy to see how the Delta variant could slow the economy’s roll here. The question, of course is, by how much – and for how long?
And yes, stocks will start to look beyond Delta’s impact at some point. This could even be starting now. But with the historical cycles pointing down hard in September, my thinking is some caution might be warranted here. At least for a while, anyway.
Lest we forget, stocks don’t always need a reason to pull back. As our furry friends remind us, garden variety pullbacks of 3-5% are quite common and don’t always require a catalyst. No, sometimes pullbacks happen, just because it’s time.
For example, according to Ned Davis Research Group, it’s been 67 days since the last 3% correction on the S&P 500, which is nearly 3X the average seen during the secular bull markets since early 1900. It is also worth noting that the S&P has gone 199 days without a 5% correction – and the average time in between such events has been 84 trading days. Oh, and just for the record, it’s been 354 days without either a 10% or 20% correction – while the averages are 331 and 1105 days respectively.
So, while traders appear to remain upbeat at the current time and one can argue that the Delta disruption will have minimal impact on corporate earnings, I for one, believe it is logical to maybe have some dry powder here. Call me crazy. Or chicken, if you must. But given that Wall Street has been a one-way street for quite some time, experience tells me to be ready for the next thing to come out of the woodwork at some point. It usually does.
Here’s hoping you have a great week. Now let’s review our indicator boards…
The Big-Picture Market Models
We start with six of our favorite long-term market models. These models are designed to help determine the “state” of the overall market.
* Source: Ned Davis Research (NDR) as of the date of publication. Historical returns are hypothetical average annual performances calculated by NDR.
The Fundamental Backdrop
Next, we review the market’s fundamental factors including interest rates, the economy, earnings, inflation, and valuations.
* Source: Ned Davis Research (NDR) as of the date of publication. Historical returns are hypothetical average annual performances calculated by NDR.
The State of the Trend
After reviewing the big-picture models and the fundamental backdrop, I like to look at the state of the current trend. This board of indicators is designed to tell us about the overall technical health of the market’s trend.
The State of Internal Momentum
Next, we analyze the momentum indicators/models to determine if there is any “oomph” behind the current move.
* Source: Ned Davis Research (NDR) as of the date of publication. Historical returns are hypothetical average annual performances calculated by NDR.
Early Warning Signals
Finally, we look at our early warning indicators to gauge the potential for counter-trend moves. This batch of indicators is designed to suggest when the table is set for the trend to “go the other way.”
* Source: Ned Davis Research (NDR) as of the date of publication. Historical returns are hypothetical average annual performances calculated by NDR.
Thought for the Day:
Breathe. Believe. Battle. -Keri Walsh Jennings
Market Models Explained
Wishing you green screens and all the best for a great day,
David D. Moenning
Director Institutional Consulting
Capital Advisors 360, LLC
Disclosures
At the time of publication, Mr. Moenning held long positions in the following securities mentioned:
None
– Note that positions may change at any time.
NOT INDIVIDUAL INVESTMENT ADVICE. IMPORTANT FURTHER DISCLOSURES
Tags: David Moenning, State of the Markets, Stock Market, Stocks, Stock Market Commentary, Stock Market Analysis, Investing
RECENT ARTICLES
The Time Has Come
The Market Panic Playbook
Bears Get Back In The Game
Sell in May, Except…
When Being Completely Wrong Works Out
Stronger For Longer?
Archives
Archives