I was recently asked to provide a quick answer to the question “where are we now?” as far as the markets are concerned. While “quick answers” are not usually part of my repertoire, I decided to give it a shot.
Cutting to the chase, I believe the stock market is currently in the process reconciling or “dealing with” various cross currents such as the Delta variant, the ultra-hot (and temporary?) inflation data, the Fed’s plans (for tapering their bond-buying program and then, in due course, raising rates), the rate of economic growth going forward, and, of course, the upcoming quarterly earnings parade.
Last week, stocks dipped – albeit briefly – as it looked like the surge in cases of the Delta variant might be causing a “rethink” of sorts on the reopening trade. Although the pullback lasted only a day, the decline did seem to be triggered by the headline that Japan had declared a state of emergency and would not be allowing fans at the upcoming Olympic Games.
Likely in response to concerns about COVID and growth, smallcaps and the “value” trades experienced a fairly nasty mean reversion correction. In short, a chart of Caterpillar (CAT) and/or Deere (DE) are the poster children for the story here. My take is these stocks had run too far too fast (DE makes farm machinery, not cures for cancer) as everyone bombed into the reopen trade. In turn, the trade became very crowded. And now that folks appear to be questioning growth rates going forward, a mean reversion trade has occurred. So, traders have been selling the reopening stocks and buying the dependable growth names (which had languished since last fall).
This is most certainly not the only mean reversion trade we’ve seen this year as market leadership has constantly been in motion. Here’s the way the game is played. A “theme/narrative” is adopted by traders. As the theme becomes popular, it also gets overdone (Wall Street has a long history of overdoing things!). Then, a new idea come to the fore. Rinse and repeat. As such, market leadership is rapidly changing, and this is a year where “chasing leaders” can get you in trouble.
Another interesting aspect to the current market is the recent decline in rates, which curiously began as the “hot” inflation data hit and all the “taper talk” started. Those “listening” to the message from the bond market are arguing that (a) inflation doesn’t look like it is going to be a problem and (b) future economic growth may be a concern.
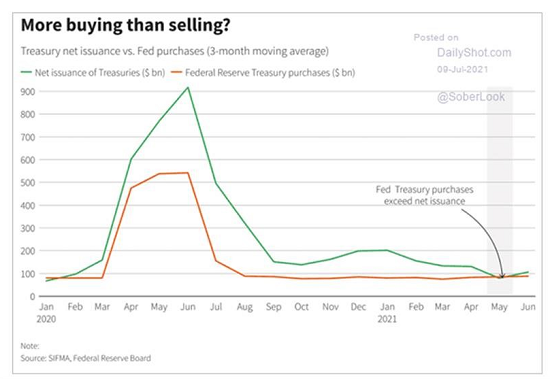
Yet, upon further review, it appears that the surprising decline in yields may actually be a case of “more buyers than sellers.” You see, government issuance of new bonds has dried up after the earlier surge tied to COVID relief/stimulus. Yet, the Fed continues to buy a boatload of bonds each month. So, since the Fed keeps buying bonds – regardless of price or technical action – there is simply too many dollars chasing too few goods. As a result, prices go up – and in this case, yields go down. The chart below from Reuters illustrates the issue nicely.
View Larger Chart
Source: Reuters/The Daily Shot
So, from my perspective, the key to the move in rates, may not really about inflation or fear of “peak growth,” but rather technical action based on the Fed continuing to buy the majority of the bonds being issued.
Looking ahead, the key to the stock market is likely to be the upcoming earnings season. Everybody knows that earnings have been great lately. But this is largely due to the economy reopening and the year-over-year comparisons. Remember, it is easy to put up big “earning beats” when a company is comparing this year’s results to the year ago numbers. You know, when the economy was shut down. But since we are now moving past the shutdown phase, the comps are likely going to get tougher.
So, the important thing will be the “forward guidance” provided on the earnings calls. I.E. What do companies see going forward? Obviously, the economy can’t keep growing at the current rate. So, the big question is what will the growth rate be once we exit the “juiced” period?
With valuations remaining extremely high (although they are starting to come down some due to improved earnings), the growth rate of the economy/earnings is likely to become mission critical. If the economy can continue to grow “above trend” on its own (without fiscal stimulus), then valuations can continue to come down over time – just as they have in the past when the economy exited a recession and returned to growth.
But, if you will recall, economic growth was weakening pre-COVID. So, if the economy starts to falter, valuations could certainly become a problem and a meaningful correction, or “mini bear” could ensue. To be clear, I am NOT making such a call. It’s just that, as a tactical risk manager, I must always be on the lookout for a change in the market regime.
For now though, things look fairly stable and the market seems to be handling the cross currents nicely. As such, the bulls deserve the benefit of any/all doubt – for now.
Here’s hoping you have a great week. Now let’s review our indicator boards…
The Big-Picture Market Models
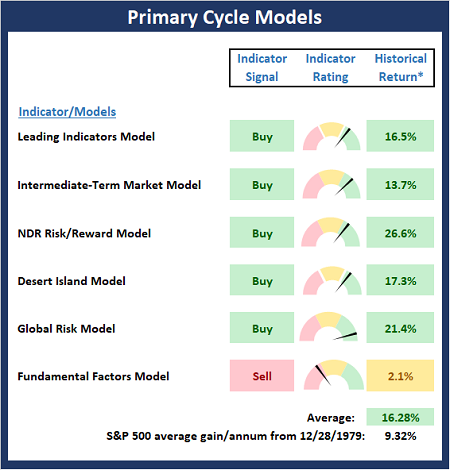
We start with six of our favorite long-term market models. These models are designed to help determine the “state” of the overall market.
* Source: Ned Davis Research (NDR) as of the date of publication. Historical returns are hypothetical average annual performances calculated by NDR.
The Fundamental Backdrop
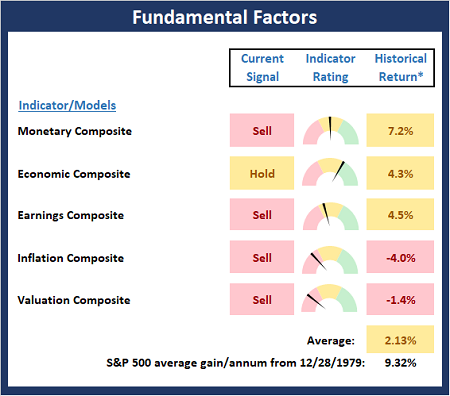
Next, we review the market’s fundamental factors including interest rates, the economy, earnings, inflation, and valuations.
* Source: Ned Davis Research (NDR) as of the date of publication. Historical returns are hypothetical average annual performances calculated by NDR.
The State of the Trend
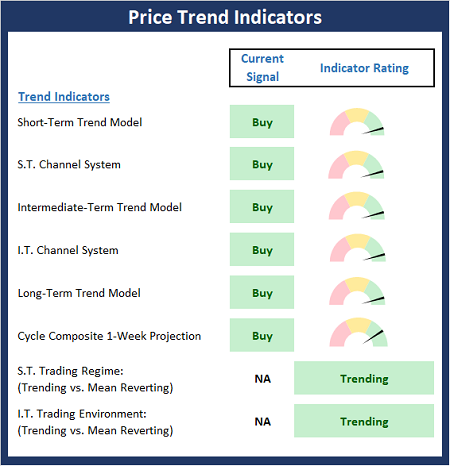
After reviewing the big-picture models and the fundamental backdrop, I like to look at the state of the current trend. This board of indicators is designed to tell us about the overall technical health of the market’s trend.
The State of Internal Momentum
Next, we analyze the momentum indicators/models to determine if there is any “oomph” behind the current move.
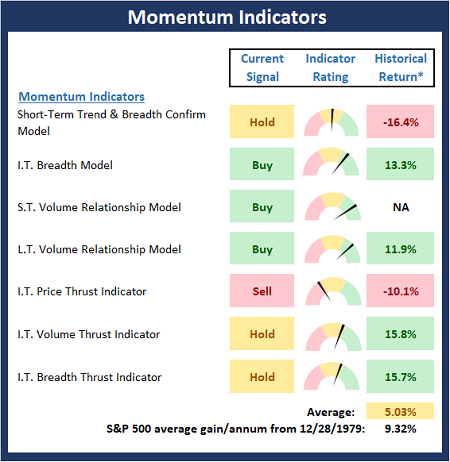
* Source: Ned Davis Research (NDR) as of the date of publication. Historical returns are hypothetical average annual performances calculated by NDR.
Early Warning Signals
Finally, we look at our early warning indicators to gauge the potential for counter-trend moves. This batch of indicators is designed to suggest when the table is set for the trend to “go the other way.”
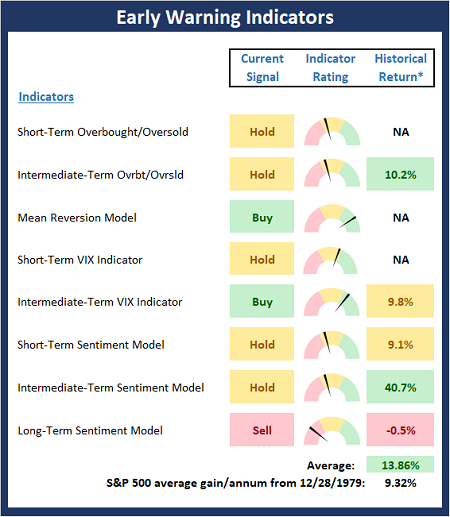
* Source: Ned Davis Research (NDR) as of the date of publication. Historical returns are hypothetical average annual performances calculated by NDR.
Thought for the Day:
Imagination was given to man to compensate him for what he is not, and a sense of humor was provided to console him for what he is. – Oscar Wilde
Market Models Explained
Wishing you green screens and all the best for a great day,

David D. Moenning
Director Institutional Consulting
Capital Advisors 360, LLC

Disclosures
At the time of publication, Mr. Moenning held long positions in the following securities mentioned:
None
– Note that positions may change at any time.
NOT INDIVIDUAL INVESTMENT ADVICE. IMPORTANT FURTHER DISCLOSURES
Tags: David Moenning, State of the Markets, Stock Market, Stocks, Stock Market Commentary, Stock Market Analysis, Investing


Institutional Consulting
David Moenning
Bulls (Still) Deserve Benefit of Doubt
I was recently asked to provide a quick answer to the question “where are we now?” as far as the markets are concerned. While “quick answers” are not usually part of my repertoire, I decided to give it a shot.
Cutting to the chase, I believe the stock market is currently in the process reconciling or “dealing with” various cross currents such as the Delta variant, the ultra-hot (and temporary?) inflation data, the Fed’s plans (for tapering their bond-buying program and then, in due course, raising rates), the rate of economic growth going forward, and, of course, the upcoming quarterly earnings parade.
Last week, stocks dipped – albeit briefly – as it looked like the surge in cases of the Delta variant might be causing a “rethink” of sorts on the reopening trade. Although the pullback lasted only a day, the decline did seem to be triggered by the headline that Japan had declared a state of emergency and would not be allowing fans at the upcoming Olympic Games.
Likely in response to concerns about COVID and growth, smallcaps and the “value” trades experienced a fairly nasty mean reversion correction. In short, a chart of Caterpillar (CAT) and/or Deere (DE) are the poster children for the story here. My take is these stocks had run too far too fast (DE makes farm machinery, not cures for cancer) as everyone bombed into the reopen trade. In turn, the trade became very crowded. And now that folks appear to be questioning growth rates going forward, a mean reversion trade has occurred. So, traders have been selling the reopening stocks and buying the dependable growth names (which had languished since last fall).
This is most certainly not the only mean reversion trade we’ve seen this year as market leadership has constantly been in motion. Here’s the way the game is played. A “theme/narrative” is adopted by traders. As the theme becomes popular, it also gets overdone (Wall Street has a long history of overdoing things!). Then, a new idea come to the fore. Rinse and repeat. As such, market leadership is rapidly changing, and this is a year where “chasing leaders” can get you in trouble.
Another interesting aspect to the current market is the recent decline in rates, which curiously began as the “hot” inflation data hit and all the “taper talk” started. Those “listening” to the message from the bond market are arguing that (a) inflation doesn’t look like it is going to be a problem and (b) future economic growth may be a concern.
Yet, upon further review, it appears that the surprising decline in yields may actually be a case of “more buyers than sellers.” You see, government issuance of new bonds has dried up after the earlier surge tied to COVID relief/stimulus. Yet, the Fed continues to buy a boatload of bonds each month. So, since the Fed keeps buying bonds – regardless of price or technical action – there is simply too many dollars chasing too few goods. As a result, prices go up – and in this case, yields go down. The chart below from Reuters illustrates the issue nicely.
View Larger Chart
Source: Reuters/The Daily Shot
So, from my perspective, the key to the move in rates, may not really about inflation or fear of “peak growth,” but rather technical action based on the Fed continuing to buy the majority of the bonds being issued.
Looking ahead, the key to the stock market is likely to be the upcoming earnings season. Everybody knows that earnings have been great lately. But this is largely due to the economy reopening and the year-over-year comparisons. Remember, it is easy to put up big “earning beats” when a company is comparing this year’s results to the year ago numbers. You know, when the economy was shut down. But since we are now moving past the shutdown phase, the comps are likely going to get tougher.
So, the important thing will be the “forward guidance” provided on the earnings calls. I.E. What do companies see going forward? Obviously, the economy can’t keep growing at the current rate. So, the big question is what will the growth rate be once we exit the “juiced” period?
With valuations remaining extremely high (although they are starting to come down some due to improved earnings), the growth rate of the economy/earnings is likely to become mission critical. If the economy can continue to grow “above trend” on its own (without fiscal stimulus), then valuations can continue to come down over time – just as they have in the past when the economy exited a recession and returned to growth.
But, if you will recall, economic growth was weakening pre-COVID. So, if the economy starts to falter, valuations could certainly become a problem and a meaningful correction, or “mini bear” could ensue. To be clear, I am NOT making such a call. It’s just that, as a tactical risk manager, I must always be on the lookout for a change in the market regime.
For now though, things look fairly stable and the market seems to be handling the cross currents nicely. As such, the bulls deserve the benefit of any/all doubt – for now.
Here’s hoping you have a great week. Now let’s review our indicator boards…
The Big-Picture Market Models
We start with six of our favorite long-term market models. These models are designed to help determine the “state” of the overall market.
* Source: Ned Davis Research (NDR) as of the date of publication. Historical returns are hypothetical average annual performances calculated by NDR.
The Fundamental Backdrop
Next, we review the market’s fundamental factors including interest rates, the economy, earnings, inflation, and valuations.
* Source: Ned Davis Research (NDR) as of the date of publication. Historical returns are hypothetical average annual performances calculated by NDR.
The State of the Trend
After reviewing the big-picture models and the fundamental backdrop, I like to look at the state of the current trend. This board of indicators is designed to tell us about the overall technical health of the market’s trend.
The State of Internal Momentum
Next, we analyze the momentum indicators/models to determine if there is any “oomph” behind the current move.
* Source: Ned Davis Research (NDR) as of the date of publication. Historical returns are hypothetical average annual performances calculated by NDR.
Early Warning Signals
Finally, we look at our early warning indicators to gauge the potential for counter-trend moves. This batch of indicators is designed to suggest when the table is set for the trend to “go the other way.”
* Source: Ned Davis Research (NDR) as of the date of publication. Historical returns are hypothetical average annual performances calculated by NDR.
Thought for the Day:
Imagination was given to man to compensate him for what he is not, and a sense of humor was provided to console him for what he is. – Oscar Wilde
Market Models Explained
Wishing you green screens and all the best for a great day,
David D. Moenning
Director Institutional Consulting
Capital Advisors 360, LLC
Disclosures
At the time of publication, Mr. Moenning held long positions in the following securities mentioned:
None
– Note that positions may change at any time.
NOT INDIVIDUAL INVESTMENT ADVICE. IMPORTANT FURTHER DISCLOSURES
Tags: David Moenning, State of the Markets, Stock Market, Stocks, Stock Market Commentary, Stock Market Analysis, Investing
RECENT ARTICLES
The Time Has Come
The Market Panic Playbook
Bears Get Back In The Game
Sell in May, Except…
When Being Completely Wrong Works Out
Stronger For Longer?
Archives
Archives