It would be easy blame the recent volatile (or, shall I say, violent) price action in both the stock and bond markets on Putin’s war. On the topic, I’m of the mind that what is happening in Eastern Europe is almost unfathomable in this day and age. A country being attacked on all sides. Tanks rolling. A 40-mile-long war convoy. Troops fighting the resistance in the streets. Civilian buildings being bombed. Ukrainians fleeing on foot with a suitcase and the dog. A nuclear plant being attacked. And nukes at the ready. Wait, what? Seriously? Can any of this really be happening in 2022? Is the universe suddenly being driven by the wayback machine, with the dial set to 1945?
But I digress. Getting back to the matter at hand, markets are indeed moving on the headlines these days. But it is important to recognize that there is more (as in, a lot more) going on here than just the war.
There is, of course, the humanitarian atrocities taking place in Ukraine which appear to be being driven by an unhinged leader. There are the derivative issues the war may create for the economies of the world. There is the Federal Reserve and what we should expect in the coming months/quarters from Jay Powell and company (as well as the other major central banks around the globe). There is the subject of inflation. And oil/energy prices. And economic growth. And, of course, corporate earnings.
As we have discussed a time or twenty, I believe the stock market can best be viewed as a discounting mechanism of future expectations. During “normal” times – you know, when the world is not gripped by a pandemic or being thrown into chaos by an unprovoked war – investors look ahead trying to determine what economic growth and corporate earnings look like in the days ahead. And while few, if any, analysts ever effectively “call” growth rates with any real accuracy, the real key is the direction and the degree of those expectations.
For example, if analysts expect the earnings from the companies of the S&P 500 to increase to record highs in the coming year, then it follows that stock prices can increase as well – likely at a rate similar to historical norms. Thus, as long as the expectations are upbeat, the bulls generally remain large and in charge.
However, if something comes along to interfere with the outlook, prices need to be adjusted to reflect the new outlook. In short, this is what the typical correction is all about.
Usually, the “something” that impacts the outlook is fairly easy to identify. Higher/lower interest rates. The rate of inflation. The Fed. A recession. Wars. And so on.
Up until the time that Putin decided to fulfill his destiny and reunite the Ukrainians with Mother Russia, markets were struggling with the idea that inflation looks to be higher for longer and that the Fed would need to return monetary policy back to some semblance of normalcy.
To be sure, these two issues are plenty and have had their impacts. For example, those go-go growth spec-tech companies that had been all the rage have fallen victim to higher rate expectations and discounted cash flow modeling. And with the ARK Innovation Fund (ARKK), which is the poster child for this space, now off more than 51% from its high (which, for the record requires a gain of more than 107% to return account values to their highs) it is safe to say that this segment of the market has experienced a bear phase.
As the saying goes, but wait, there’s more. Now that Putin has decided to grab some additional shoreline property, there are more factors for investors to consider. Cutting to the chase, the war appears to be adding to the world’s already disconcerting inflation problems, as oil and a bunch of commodities have soared. In addition, the invasion looks to be creating more “supply chain issues,” which have been a key component of the inflation issue.
And with the world looking to boycott any/all things Russian, energy prices are spiking. Although anecdotal, I can personally attest to this fact. I’m writing to you this week from La Quinta, California, where gasoline prices now sport a $5 handle, which definitely gets your attention. In simple terms, surging gas prices represent a “tax on consumers,” which, if sustained, will eventually impact demand/spending on other things. And, of course, this is not a desired result in terms of economic growth.
Continuing to extrapolate here, some argue that these additional inflation pressures will cause Powell & Co (as well as his central banker counterparts in the UK, EU, etc.) to make further adjustments to their monetary policy/rate hiking plans.
And then there is the issue of economic growth. Don’t look now fans, but growth is slowing. Sure, Friday’s jobs report suggests the economy is “doing just fine, thank you.” However, recent data shows the rate of growth to be slowing. February’s ISM Non-Manufacturing report is Exhibit A here as the index fell for a 3rd straight month to the lowest level in a year. As a result, the Atlanta Fed’s GDPNow index projects the growth rate for the current quarter to be nil.
No, the economy is not at risk of recession. But as we’ve discussed at length in the past, the recent stellar rate of economic growth was unsustainable. So, we’ve known that at some point, growth would slow. And that point appears to be now.
The next question is, what will the economy’s growth rate be going forward? What will growth look like now that the stimulus checks have been spent and the Fed is no longer flooding the system with cash? Will GDP fall back into the sluggish mode seen pre-pandemic? Or will we see GDP increasing at a healthy clip? Time will tell.
The bottom line is there is a fair amount of uncertainty about the future at this time. And we all know how Ms. Market hates uncertainty. As such, the fact that the S&P 500 appears to be moving up and down within in a range (between 4250 and 4600/4800) shouldn’t be too surprising.
My take is that stocks may need some time to “work through” the issues at hand and to get comfy with the outlook for the rest of the year. Thus, I won’t be surprised to see the market “kill some time” while figuring things out. In other words, stocks could certainly remain in a trading range for a while. Which, of course, beats the more bearish alternative. Fingers crossed!
Now let’s review the “state of the market” through the lens of our market models…
The Big-Picture Market Models
We start with six of our favorite long-term market models. These models are designed to help determine the “state” of the overall market.
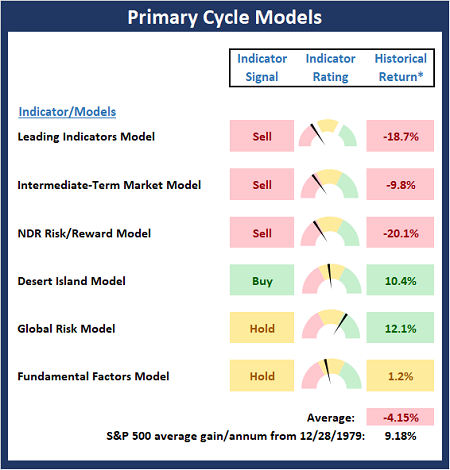
* Source: Ned Davis Research (NDR) as of the date of publication. Historical returns are hypothetical average annual performances calculated by NDR.
The Fundamental Backdrop
Next, we review the market’s fundamental factors including interest rates, the economy, earnings, inflation, and valuations.
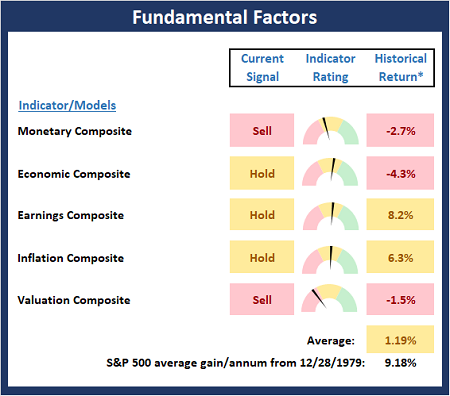
* Source: Ned Davis Research (NDR) as of the date of publication. Historical returns are hypothetical average annual performances calculated by NDR.
The State of the Trend
After reviewing the big-picture models and the fundamental backdrop, I like to look at the state of the current trend. This board of indicators is designed to tell us about the overall technical health of the market’s trend.
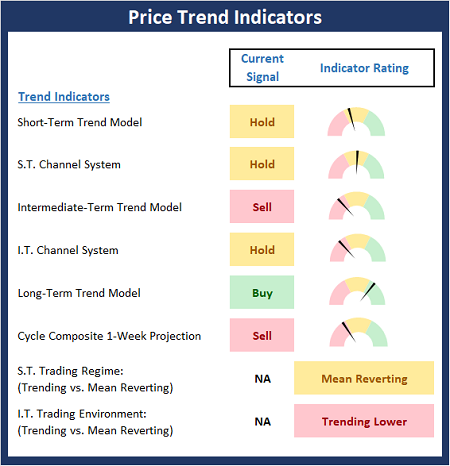
The State of Internal Momentum
Next, we analyze the momentum indicators/models to determine if there is any “oomph” behind the current move.
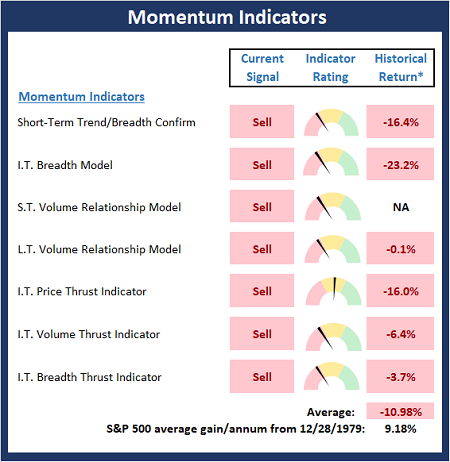
* Source: Ned Davis Research (NDR) as of the date of publication. Historical returns are hypothetical average annual performances calculated by NDR.
Early Warning Indicators
Finally, we look at our early warning indicators to gauge the potential for countertrend moves. This batch of indicators is designed to suggest when the table is set for the trend to “go the other way.”
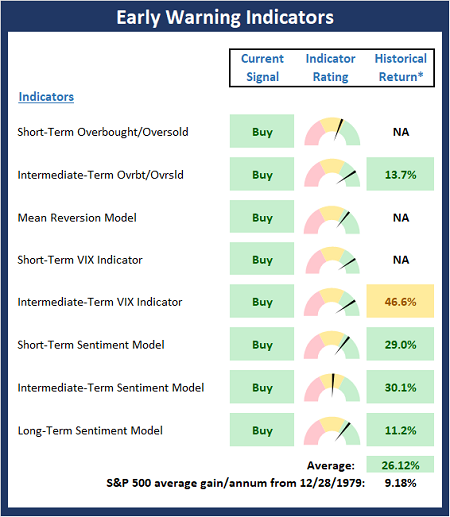
* Source: Ned Davis Research (NDR) as of the date of publication. Historical returns are hypothetical average annual performances calculated by NDR.
Thought for the Day:
Employ your time in improving yourself by other men’s writings, so that you shall gain easily what others have labored hard for -Socrates
Market Models Explained
Wishing you green screens and all the best for a great day,

David D. Moenning
Director Institutional Consulting
Capital Advisors 360, LLC

Disclosures
At the time of publication, Mr. Moenning held long positions in the following securities mentioned:
None
– Note that positions may change at any time.
NOT INDIVIDUAL INVESTMENT ADVICE. IMPORTANT FURTHER DISCLOSURES
Tags: David Moenning, State of the Markets, Stock Market, Stocks, Stock Market Commentary, Stock Market Analysis, Investing


Institutional Consulting
David Moenning
Blame It On Putin?
It would be easy blame the recent volatile (or, shall I say, violent) price action in both the stock and bond markets on Putin’s war. On the topic, I’m of the mind that what is happening in Eastern Europe is almost unfathomable in this day and age. A country being attacked on all sides. Tanks rolling. A 40-mile-long war convoy. Troops fighting the resistance in the streets. Civilian buildings being bombed. Ukrainians fleeing on foot with a suitcase and the dog. A nuclear plant being attacked. And nukes at the ready. Wait, what? Seriously? Can any of this really be happening in 2022? Is the universe suddenly being driven by the wayback machine, with the dial set to 1945?
But I digress. Getting back to the matter at hand, markets are indeed moving on the headlines these days. But it is important to recognize that there is more (as in, a lot more) going on here than just the war.
There is, of course, the humanitarian atrocities taking place in Ukraine which appear to be being driven by an unhinged leader. There are the derivative issues the war may create for the economies of the world. There is the Federal Reserve and what we should expect in the coming months/quarters from Jay Powell and company (as well as the other major central banks around the globe). There is the subject of inflation. And oil/energy prices. And economic growth. And, of course, corporate earnings.
As we have discussed a time or twenty, I believe the stock market can best be viewed as a discounting mechanism of future expectations. During “normal” times – you know, when the world is not gripped by a pandemic or being thrown into chaos by an unprovoked war – investors look ahead trying to determine what economic growth and corporate earnings look like in the days ahead. And while few, if any, analysts ever effectively “call” growth rates with any real accuracy, the real key is the direction and the degree of those expectations.
For example, if analysts expect the earnings from the companies of the S&P 500 to increase to record highs in the coming year, then it follows that stock prices can increase as well – likely at a rate similar to historical norms. Thus, as long as the expectations are upbeat, the bulls generally remain large and in charge.
However, if something comes along to interfere with the outlook, prices need to be adjusted to reflect the new outlook. In short, this is what the typical correction is all about.
Usually, the “something” that impacts the outlook is fairly easy to identify. Higher/lower interest rates. The rate of inflation. The Fed. A recession. Wars. And so on.
Up until the time that Putin decided to fulfill his destiny and reunite the Ukrainians with Mother Russia, markets were struggling with the idea that inflation looks to be higher for longer and that the Fed would need to return monetary policy back to some semblance of normalcy.
To be sure, these two issues are plenty and have had their impacts. For example, those go-go growth spec-tech companies that had been all the rage have fallen victim to higher rate expectations and discounted cash flow modeling. And with the ARK Innovation Fund (ARKK), which is the poster child for this space, now off more than 51% from its high (which, for the record requires a gain of more than 107% to return account values to their highs) it is safe to say that this segment of the market has experienced a bear phase.
As the saying goes, but wait, there’s more. Now that Putin has decided to grab some additional shoreline property, there are more factors for investors to consider. Cutting to the chase, the war appears to be adding to the world’s already disconcerting inflation problems, as oil and a bunch of commodities have soared. In addition, the invasion looks to be creating more “supply chain issues,” which have been a key component of the inflation issue.
And with the world looking to boycott any/all things Russian, energy prices are spiking. Although anecdotal, I can personally attest to this fact. I’m writing to you this week from La Quinta, California, where gasoline prices now sport a $5 handle, which definitely gets your attention. In simple terms, surging gas prices represent a “tax on consumers,” which, if sustained, will eventually impact demand/spending on other things. And, of course, this is not a desired result in terms of economic growth.
Continuing to extrapolate here, some argue that these additional inflation pressures will cause Powell & Co (as well as his central banker counterparts in the UK, EU, etc.) to make further adjustments to their monetary policy/rate hiking plans.
And then there is the issue of economic growth. Don’t look now fans, but growth is slowing. Sure, Friday’s jobs report suggests the economy is “doing just fine, thank you.” However, recent data shows the rate of growth to be slowing. February’s ISM Non-Manufacturing report is Exhibit A here as the index fell for a 3rd straight month to the lowest level in a year. As a result, the Atlanta Fed’s GDPNow index projects the growth rate for the current quarter to be nil.
No, the economy is not at risk of recession. But as we’ve discussed at length in the past, the recent stellar rate of economic growth was unsustainable. So, we’ve known that at some point, growth would slow. And that point appears to be now.
The next question is, what will the economy’s growth rate be going forward? What will growth look like now that the stimulus checks have been spent and the Fed is no longer flooding the system with cash? Will GDP fall back into the sluggish mode seen pre-pandemic? Or will we see GDP increasing at a healthy clip? Time will tell.
The bottom line is there is a fair amount of uncertainty about the future at this time. And we all know how Ms. Market hates uncertainty. As such, the fact that the S&P 500 appears to be moving up and down within in a range (between 4250 and 4600/4800) shouldn’t be too surprising.
My take is that stocks may need some time to “work through” the issues at hand and to get comfy with the outlook for the rest of the year. Thus, I won’t be surprised to see the market “kill some time” while figuring things out. In other words, stocks could certainly remain in a trading range for a while. Which, of course, beats the more bearish alternative. Fingers crossed!
Now let’s review the “state of the market” through the lens of our market models…
The Big-Picture Market Models
We start with six of our favorite long-term market models. These models are designed to help determine the “state” of the overall market.
* Source: Ned Davis Research (NDR) as of the date of publication. Historical returns are hypothetical average annual performances calculated by NDR.
The Fundamental Backdrop
Next, we review the market’s fundamental factors including interest rates, the economy, earnings, inflation, and valuations.
* Source: Ned Davis Research (NDR) as of the date of publication. Historical returns are hypothetical average annual performances calculated by NDR.
The State of the Trend
After reviewing the big-picture models and the fundamental backdrop, I like to look at the state of the current trend. This board of indicators is designed to tell us about the overall technical health of the market’s trend.
The State of Internal Momentum
Next, we analyze the momentum indicators/models to determine if there is any “oomph” behind the current move.
* Source: Ned Davis Research (NDR) as of the date of publication. Historical returns are hypothetical average annual performances calculated by NDR.
Early Warning Indicators
Finally, we look at our early warning indicators to gauge the potential for countertrend moves. This batch of indicators is designed to suggest when the table is set for the trend to “go the other way.”
* Source: Ned Davis Research (NDR) as of the date of publication. Historical returns are hypothetical average annual performances calculated by NDR.
Thought for the Day:
Employ your time in improving yourself by other men’s writings, so that you shall gain easily what others have labored hard for -Socrates
Market Models Explained
Wishing you green screens and all the best for a great day,
David D. Moenning
Director Institutional Consulting
Capital Advisors 360, LLC
Disclosures
At the time of publication, Mr. Moenning held long positions in the following securities mentioned:
None
– Note that positions may change at any time.
NOT INDIVIDUAL INVESTMENT ADVICE. IMPORTANT FURTHER DISCLOSURES
Tags: David Moenning, State of the Markets, Stock Market, Stocks, Stock Market Commentary, Stock Market Analysis, Investing
RECENT ARTICLES
The Time Has Come
The Market Panic Playbook
Bears Get Back In The Game
Sell in May, Except…
When Being Completely Wrong Works Out
Stronger For Longer?
Archives
Archives