It’s been a very busy start to the new year and there are a great many pieces to the puzzle that make up this market. While I am short on time this morning, let’s see if we can’t run through the host of issues that investors are attempting to deal with at the present time.
Let’s see here… We’ve got insane volatility. Lots and lots (and lots) of Fedspeak. A spike in rates. The Omicron surge. Slowing economic growth. More supply chain problems. Persistent inflation. A potential war. Waning stimulus (with perhaps little to nothing more on the horizon). The big boys continuing to print money. Worries about “peak margins” in Corporate America. Oh, and the repricing of assets based on any/all of the above, which has led to a market whose behavior may be best described as childlike at times (hat tip to my son, Donald Moenning for that phrase).
From a big picture standpoint, my key takeaway is that both the stock and bond markets are in the process of rethinking/repricing index constituents large and small based on the “new normal” we now find ourselves in. An environment where one of the largest companies in the world can lose 26%, or something on the order of $250 billion – in a day. An environment which takes entire swathes of stocks up/down like crazy based on a headline or “narrative.” A macro narrative that often revolves around the idea that higher interest rates will impact either a company’s growth or the expected return to investors. An environment where “liquidity” in the world’s largest markets is once again under scrutiny. An environment where the machines are clearly in charge. An environment where “sell first and ask questions later” seems to be the primary battle cry. And an environment where the central bankers of the world – and this is especially true here in the good ‘ol USofA – are no longer your portfolio’s best friend.
In short, this is what corrections are all about. And as the saying goes, corrections are only “normal and healthy” until you are in one. Then they have a tendency to scare the bejeebers out of you.
But, right about the time everyone in the game starts talking about the number of stocks in “correction” or “bear market” territory, a rebound occurs. Why? Because Wall Street has a longstanding history of overdoing EVERYTHING. So, once a decline starts to look/feel a little ridiculous (yes, that’s a technical term), folks start talking about the “values” they are seeing. And before you can calculate the move needed to get your account back to where it stood a month ago, the bulls take a stand.
From my seat, this is exactly what is happening at the present time. Stock and bond traders are in the process of adjusting to a changing environment. A transition, if you will, from one regime to another. I.E. from really strong growth/earnings to not so really strong. From an uber-friendly Fed to an antagonistic one. A process that in today’s world tends to be both swift and violent.
Gone are the days when corrections took time. Nope. Nowadays, the algos react at the speed of light. And before you can blink the company formerly known as Facebook (FB) has lost 26% – in a day. And yes, yes, I agree that Meta’s decline was likely more company-specific than an indication of the state of the market overall. The outlook for big, fast growers often changes over time as companies mature. Think IBM back in the day. Microsoft in the early 2000’s – and then again from 2014/15 forward. And so on, and so on. But come on. The idea that a company the size of FB, with its massive cash generation power, can lose more than a quarter of its value – in a day – certainly gets your attention.
But this is the way the game is played these days. Risk happens fast. And there are few sure things when the environment changes. So, until market players get comfy with what the economy, earnings and Fed policy looks like going forward, we can probably expect the machines to continue to make the market game, well, interesting.
Now let’s review the “state of the market” through the lens of our market models…
The Big-Picture Market Models
We start with six of our favorite long-term market models. These models are designed to help determine the “state” of the overall market.
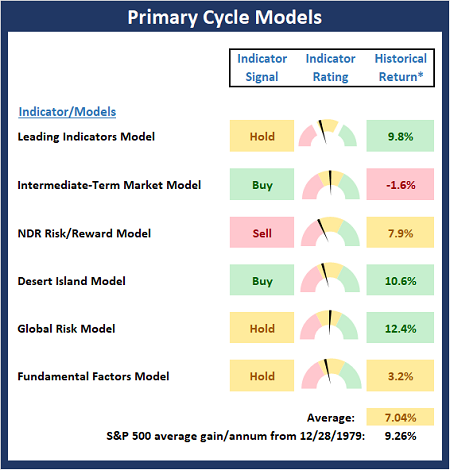
* Source: Ned Davis Research (NDR) as of the date of publication. Historical returns are hypothetical average annual performances calculated by NDR.
The Fundamental Backdrop
Next, we review the market’s fundamental factors including interest rates, the economy, earnings, inflation, and valuations.
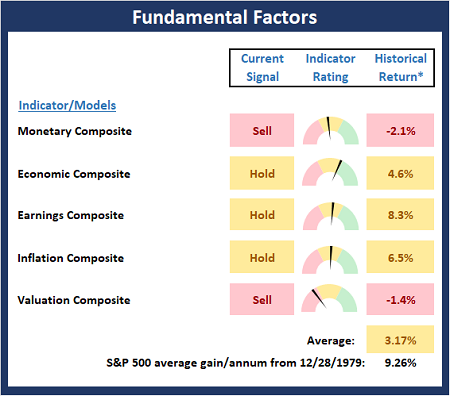
* Source: Ned Davis Research (NDR) as of the date of publication. Historical returns are hypothetical average annual performances calculated by NDR.
The State of the Trend
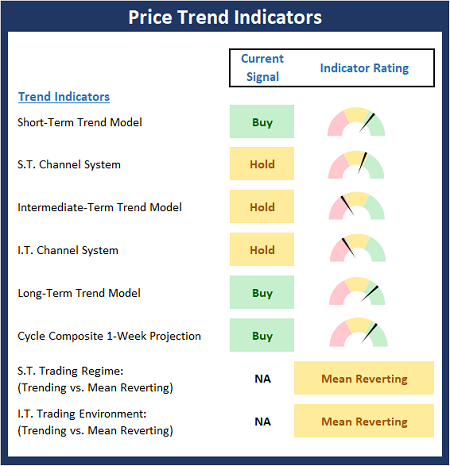
After reviewing the big-picture models and the fundamental backdrop, I like to look at the state of the current trend. This board of indicators is designed to tell us about the overall technical health of the market’s trend.
The State of Internal Momentum
Next, we analyze the momentum indicators/models to determine if there is any “oomph” behind the current move.
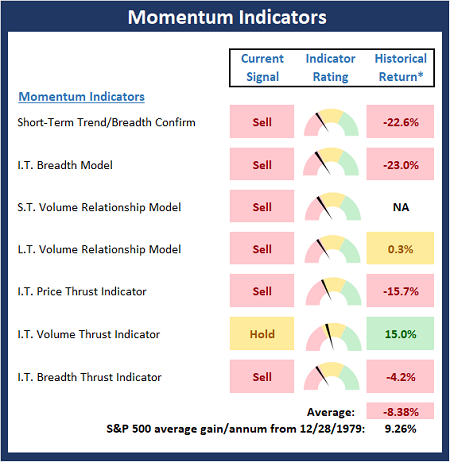
* Source: Ned Davis Research (NDR) as of the date of publication. Historical returns are hypothetical average annual performances calculated by NDR.
Early Warning Indicators
Finally, we look at our early warning indicators to gauge the potential for countertrend moves. This batch of indicators is designed to suggest when the table is set for the trend to “go the other way.”
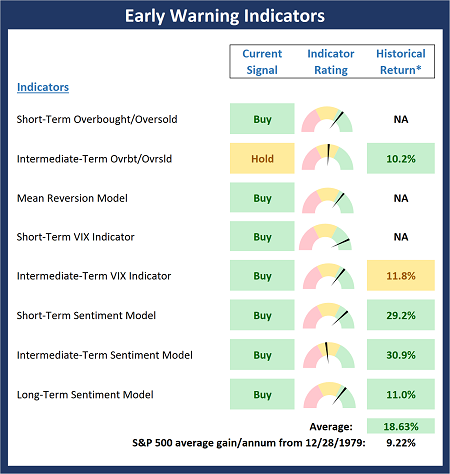
* Source: Ned Davis Research (NDR) as of the date of publication. Historical returns are hypothetical average annual performances calculated by NDR.
Thought for the Day:
Get out when the market lets you out. -Paul Tudor Jones
Market Models Explained
Wishing you green screens and all the best for a great day,

David D. Moenning
Director Institutional Consulting
Capital Advisors 360, LLC

Disclosures
At the time of publication, Mr. Moenning held long positions in the following securities mentioned:
MSFT
– Note that positions may change at any time.
NOT INDIVIDUAL INVESTMENT ADVICE. IMPORTANT FURTHER DISCLOSURES


Institutional Consulting
David Moenning
Are We Having Fun Yet?
It’s been a very busy start to the new year and there are a great many pieces to the puzzle that make up this market. While I am short on time this morning, let’s see if we can’t run through the host of issues that investors are attempting to deal with at the present time.
Let’s see here… We’ve got insane volatility. Lots and lots (and lots) of Fedspeak. A spike in rates. The Omicron surge. Slowing economic growth. More supply chain problems. Persistent inflation. A potential war. Waning stimulus (with perhaps little to nothing more on the horizon). The big boys continuing to print money. Worries about “peak margins” in Corporate America. Oh, and the repricing of assets based on any/all of the above, which has led to a market whose behavior may be best described as childlike at times (hat tip to my son, Donald Moenning for that phrase).
From a big picture standpoint, my key takeaway is that both the stock and bond markets are in the process of rethinking/repricing index constituents large and small based on the “new normal” we now find ourselves in. An environment where one of the largest companies in the world can lose 26%, or something on the order of $250 billion – in a day. An environment which takes entire swathes of stocks up/down like crazy based on a headline or “narrative.” A macro narrative that often revolves around the idea that higher interest rates will impact either a company’s growth or the expected return to investors. An environment where “liquidity” in the world’s largest markets is once again under scrutiny. An environment where the machines are clearly in charge. An environment where “sell first and ask questions later” seems to be the primary battle cry. And an environment where the central bankers of the world – and this is especially true here in the good ‘ol USofA – are no longer your portfolio’s best friend.
In short, this is what corrections are all about. And as the saying goes, corrections are only “normal and healthy” until you are in one. Then they have a tendency to scare the bejeebers out of you.
But, right about the time everyone in the game starts talking about the number of stocks in “correction” or “bear market” territory, a rebound occurs. Why? Because Wall Street has a longstanding history of overdoing EVERYTHING. So, once a decline starts to look/feel a little ridiculous (yes, that’s a technical term), folks start talking about the “values” they are seeing. And before you can calculate the move needed to get your account back to where it stood a month ago, the bulls take a stand.
From my seat, this is exactly what is happening at the present time. Stock and bond traders are in the process of adjusting to a changing environment. A transition, if you will, from one regime to another. I.E. from really strong growth/earnings to not so really strong. From an uber-friendly Fed to an antagonistic one. A process that in today’s world tends to be both swift and violent.
Gone are the days when corrections took time. Nope. Nowadays, the algos react at the speed of light. And before you can blink the company formerly known as Facebook (FB) has lost 26% – in a day. And yes, yes, I agree that Meta’s decline was likely more company-specific than an indication of the state of the market overall. The outlook for big, fast growers often changes over time as companies mature. Think IBM back in the day. Microsoft in the early 2000’s – and then again from 2014/15 forward. And so on, and so on. But come on. The idea that a company the size of FB, with its massive cash generation power, can lose more than a quarter of its value – in a day – certainly gets your attention.
But this is the way the game is played these days. Risk happens fast. And there are few sure things when the environment changes. So, until market players get comfy with what the economy, earnings and Fed policy looks like going forward, we can probably expect the machines to continue to make the market game, well, interesting.
Now let’s review the “state of the market” through the lens of our market models…
The Big-Picture Market Models
We start with six of our favorite long-term market models. These models are designed to help determine the “state” of the overall market.
* Source: Ned Davis Research (NDR) as of the date of publication. Historical returns are hypothetical average annual performances calculated by NDR.
The Fundamental Backdrop
Next, we review the market’s fundamental factors including interest rates, the economy, earnings, inflation, and valuations.
* Source: Ned Davis Research (NDR) as of the date of publication. Historical returns are hypothetical average annual performances calculated by NDR.
The State of the Trend
After reviewing the big-picture models and the fundamental backdrop, I like to look at the state of the current trend. This board of indicators is designed to tell us about the overall technical health of the market’s trend.
The State of Internal Momentum
Next, we analyze the momentum indicators/models to determine if there is any “oomph” behind the current move.
* Source: Ned Davis Research (NDR) as of the date of publication. Historical returns are hypothetical average annual performances calculated by NDR.
Early Warning Indicators
Finally, we look at our early warning indicators to gauge the potential for countertrend moves. This batch of indicators is designed to suggest when the table is set for the trend to “go the other way.”
* Source: Ned Davis Research (NDR) as of the date of publication. Historical returns are hypothetical average annual performances calculated by NDR.
Thought for the Day:
Get out when the market lets you out. -Paul Tudor Jones
Market Models Explained
Wishing you green screens and all the best for a great day,
David D. Moenning
Director Institutional Consulting
Capital Advisors 360, LLC
Disclosures
At the time of publication, Mr. Moenning held long positions in the following securities mentioned:
MSFT
– Note that positions may change at any time.
NOT INDIVIDUAL INVESTMENT ADVICE. IMPORTANT FURTHER DISCLOSURES
RECENT ARTICLES
The Time Has Come
The Market Panic Playbook
Bears Get Back In The Game
Sell in May, Except…
When Being Completely Wrong Works Out
Stronger For Longer?
Archives
Archives