The State of the Market
Although the exchanges were shut on Friday, yet another important economic indicator came in well above expectations. In case you were otherwise occupied, it is worth noting that nonfarm payrolls accelerated in March by 916,000, which was well above the consensus estimate of 675,000. In addition, the prior two months were also revised higher, adding a total of 156,000 new jobs to the current totals. And the unemployment rate fell to 6.0% from 6.2%. All good news.
This is on the back of last week’s update to the ISM Manufacturing Index, which came in at a 37-year high. The rebound from February’s winter storms, the vaccine rollouts, more economic re-openings, and expected additional support out of Washington appear to have all contributed to the recent improvement in the economic data.
To aptly sum up the current state of the economy, I’ll borrow the words of CNBC’s Mike Santoli, who wrote Monday, “the economy is revving hard right now.”
Then when you consider that, according to data from Johns Hopkins, approximately 50% of the adult population in the U.S. has received at least one dose of a coronavirus vaccine, well, it’s hard not to be optimistic about the outlook for a return to normalcy in the not-too distant future. Also, good news.
As someone who has received two doses of the Moderna vaccine, I concur with the upbeat mood the economy looks to be in. Now that the odds of contracting COVID and/or the virus sending us to a hospital now quite small, my wife and I find ourselves looking forward to seeing family and friends – and returning to our travel schedule. And on that note, I can attest that there is indeed pent-up demand for travel – at least in my household!
So, am I surprised to see stock prices movin’ on up again to new all-time highs this morning? In short, not at all. A rising market on the back of an improving economic and earnings environment (according to FactSet, analysts have boosted their EPS forecasts by 6% over that past three months and estimates for calendar year 2021 are up 5%) makes sense.
In addition, investors are heartened by the idea that more stimulus out of D.C. is likely coming. Oh, and the Fed has pledged to keep rates low this year. So, again, what’s not to like… onward and upward, right?
While I don’t disagree with any of the above and it is hard to argue with the bullish backdrop, one piece of anecdotal evidence I saw on the state of the stock market last week continues to nag at me and is causing me to curb my enthusiasm just a bit. You see, I heard a report last week that GE – one of the poster children for the value/cyclical trade currently carries the same P/E as Netflix. Yikes.
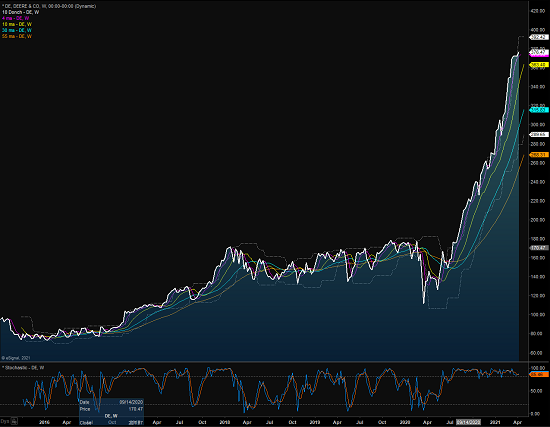
Then, when perusing the charts of some of the current market leaders, I find myself wondering how much further a stock like Deere can go. Take a look at the chart below and see if you don’t agree.
View Larger Chart
My point on this fine Monday morning is that the current focus on Wall Street seems to be reopening plays as well as the rotation into value/cyclical names. However, in the case of DE and CAT, I have to wonder whether a lot of the good stuff that is expected to come this year might already be – or at least largely priced into these names. After all, the growth prospects for a company that sells tractors is clearly more limited than one that is curing cancer or selling software or services that change the way we work/shop/live.
So, while I’m onboard the bull train and I plan to remain in my seat until the train starts to slow, I also believe that the oftentimes violent rotational moves that the market has experienced of late are likely to continue. As such, I’m not sure this is a low risk, buy anything, type of environment and that index selection is very important at this time.
And finally, we should probably keep in mind that trees don’t grow to the sky and that Wall Street tends to overdo most everything – in both directions. So, here’s hoping that the current joyride to the upside doesn’t get out of hand.
Here’s hoping you have a great week. Now let’s turn to our expanded weekly model update…
Weekly Model Review
Each week we do a deep dive into our key market indicators and models. The overall goal of this exercise is to (a) remove emotion from the investment process, (b) stay “in tune” with the primary market cycles, and (c) remain cognizant of the risk/reward environment.
The Big-Picture Market Models
We start with six of our favorite long-term market models. These models are designed to help determine the “state” of the overall market.
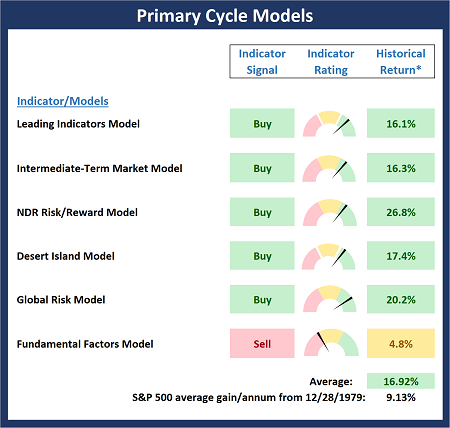
* Source: Ned Davis Research (NDR) as of the date of publication. Historical returns are hypothetical average annual performances calculated by NDR.
The Fundamental Backdrop
Next, we review the market’s fundamental factors including interest rates, the economy, earnings, inflation, and valuations.
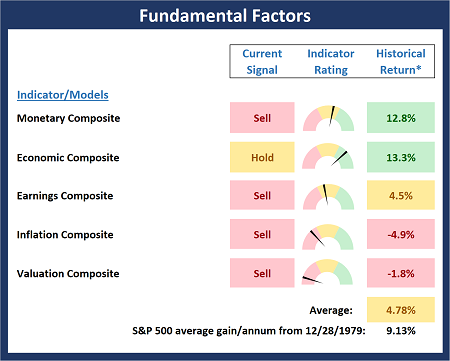
* Source: Ned Davis Research (NDR) as of the date of publication. Historical returns are hypothetical average annual performances calculated by NDR.
The State of the Trend
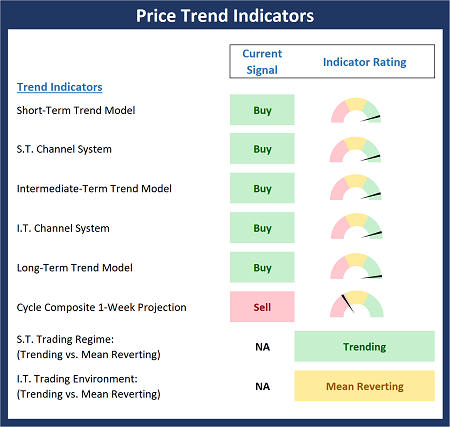
After reviewing the big-picture models and the fundamental backdrop, I like to look at the state of the current trend. This board of indicators is designed to tell us about the overall technical health of the market’s trend.
The State of Internal Momentum
Next, we analyze the momentum indicators/models to determine if there is any “oomph” behind the current move.
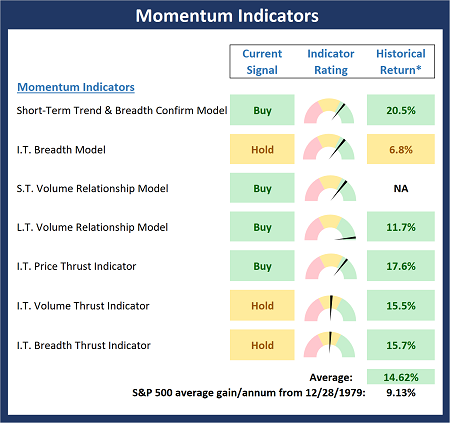
* Source: Ned Davis Research (NDR) as of the date of publication. Historical returns are hypothetical average annual performances calculated by NDR.
Early Warning Signals
Finally, we look at our early warning indicators to gauge the potential for counter-trend moves. This batch of indicators is designed to suggest when the table is set for the trend to “go the other way.”
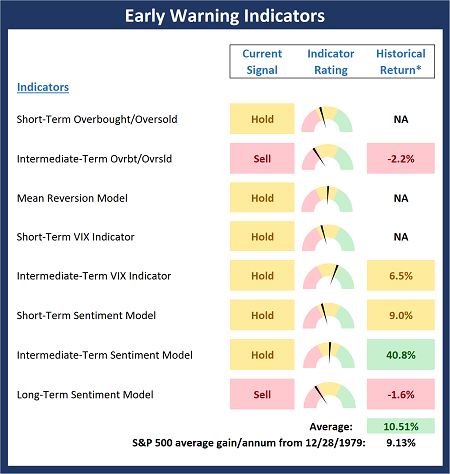
* Source: Ned Davis Research (NDR) as of the date of publication. Historical returns are hypothetical average annual performances calculated by NDR.
Market Models Explained
Thought for the Day:
The single biggest waste of time on earth is wishing things were different. -Don Connelly
Market Models Explained
Wishing you green screens and all the best for a great day,

David D. Moenning
Director Institutional Consulting
Capital Advisors 360, LLC

Disclosures
At the time of publication, Mr. Moenning held long positions in the following securities mentioned:
None
– Note that positions may change at any time.
NOT INDIVIDUAL INVESTMENT ADVICE. IMPORTANT FURTHER DISCLOSURES
Tags: David Moenning, State of the Markets, Stock Market, Stocks, Stock Market Commentary, Stock Market Analysis, Investing


Institutional Consulting
David Moenning
All Good News, But…
The State of the Market
Although the exchanges were shut on Friday, yet another important economic indicator came in well above expectations. In case you were otherwise occupied, it is worth noting that nonfarm payrolls accelerated in March by 916,000, which was well above the consensus estimate of 675,000. In addition, the prior two months were also revised higher, adding a total of 156,000 new jobs to the current totals. And the unemployment rate fell to 6.0% from 6.2%. All good news.
This is on the back of last week’s update to the ISM Manufacturing Index, which came in at a 37-year high. The rebound from February’s winter storms, the vaccine rollouts, more economic re-openings, and expected additional support out of Washington appear to have all contributed to the recent improvement in the economic data.
To aptly sum up the current state of the economy, I’ll borrow the words of CNBC’s Mike Santoli, who wrote Monday, “the economy is revving hard right now.”
Then when you consider that, according to data from Johns Hopkins, approximately 50% of the adult population in the U.S. has received at least one dose of a coronavirus vaccine, well, it’s hard not to be optimistic about the outlook for a return to normalcy in the not-too distant future. Also, good news.
As someone who has received two doses of the Moderna vaccine, I concur with the upbeat mood the economy looks to be in. Now that the odds of contracting COVID and/or the virus sending us to a hospital now quite small, my wife and I find ourselves looking forward to seeing family and friends – and returning to our travel schedule. And on that note, I can attest that there is indeed pent-up demand for travel – at least in my household!
So, am I surprised to see stock prices movin’ on up again to new all-time highs this morning? In short, not at all. A rising market on the back of an improving economic and earnings environment (according to FactSet, analysts have boosted their EPS forecasts by 6% over that past three months and estimates for calendar year 2021 are up 5%) makes sense.
In addition, investors are heartened by the idea that more stimulus out of D.C. is likely coming. Oh, and the Fed has pledged to keep rates low this year. So, again, what’s not to like… onward and upward, right?
While I don’t disagree with any of the above and it is hard to argue with the bullish backdrop, one piece of anecdotal evidence I saw on the state of the stock market last week continues to nag at me and is causing me to curb my enthusiasm just a bit. You see, I heard a report last week that GE – one of the poster children for the value/cyclical trade currently carries the same P/E as Netflix. Yikes.
Then, when perusing the charts of some of the current market leaders, I find myself wondering how much further a stock like Deere can go. Take a look at the chart below and see if you don’t agree.
View Larger Chart
My point on this fine Monday morning is that the current focus on Wall Street seems to be reopening plays as well as the rotation into value/cyclical names. However, in the case of DE and CAT, I have to wonder whether a lot of the good stuff that is expected to come this year might already be – or at least largely priced into these names. After all, the growth prospects for a company that sells tractors is clearly more limited than one that is curing cancer or selling software or services that change the way we work/shop/live.
So, while I’m onboard the bull train and I plan to remain in my seat until the train starts to slow, I also believe that the oftentimes violent rotational moves that the market has experienced of late are likely to continue. As such, I’m not sure this is a low risk, buy anything, type of environment and that index selection is very important at this time.
And finally, we should probably keep in mind that trees don’t grow to the sky and that Wall Street tends to overdo most everything – in both directions. So, here’s hoping that the current joyride to the upside doesn’t get out of hand.
Here’s hoping you have a great week. Now let’s turn to our expanded weekly model update…
Weekly Model Review
Each week we do a deep dive into our key market indicators and models. The overall goal of this exercise is to (a) remove emotion from the investment process, (b) stay “in tune” with the primary market cycles, and (c) remain cognizant of the risk/reward environment.
The Big-Picture Market Models
We start with six of our favorite long-term market models. These models are designed to help determine the “state” of the overall market.
* Source: Ned Davis Research (NDR) as of the date of publication. Historical returns are hypothetical average annual performances calculated by NDR.
The Fundamental Backdrop
Next, we review the market’s fundamental factors including interest rates, the economy, earnings, inflation, and valuations.
* Source: Ned Davis Research (NDR) as of the date of publication. Historical returns are hypothetical average annual performances calculated by NDR.
The State of the Trend
After reviewing the big-picture models and the fundamental backdrop, I like to look at the state of the current trend. This board of indicators is designed to tell us about the overall technical health of the market’s trend.
The State of Internal Momentum
Next, we analyze the momentum indicators/models to determine if there is any “oomph” behind the current move.
* Source: Ned Davis Research (NDR) as of the date of publication. Historical returns are hypothetical average annual performances calculated by NDR.
Early Warning Signals
Finally, we look at our early warning indicators to gauge the potential for counter-trend moves. This batch of indicators is designed to suggest when the table is set for the trend to “go the other way.”
* Source: Ned Davis Research (NDR) as of the date of publication. Historical returns are hypothetical average annual performances calculated by NDR.
Market Models Explained
Thought for the Day:
The single biggest waste of time on earth is wishing things were different. -Don Connelly
Market Models Explained
Wishing you green screens and all the best for a great day,
David D. Moenning
Director Institutional Consulting
Capital Advisors 360, LLC
Disclosures
At the time of publication, Mr. Moenning held long positions in the following securities mentioned:
None
– Note that positions may change at any time.
NOT INDIVIDUAL INVESTMENT ADVICE. IMPORTANT FURTHER DISCLOSURES
Tags: David Moenning, State of the Markets, Stock Market, Stocks, Stock Market Commentary, Stock Market Analysis, Investing
RECENT ARTICLES
The Time Has Come
The Market Panic Playbook
Bears Get Back In The Game
Sell in May, Except…
When Being Completely Wrong Works Out
Stronger For Longer?
Archives
Archives