About a month ago – you know, back when stocks were making “higher highs,” new buy signals were flashing, and everybody was thinking that we’d seen the worst of the bear market – I remarked privately to a couple colleagues that while things were going well at the time, my biggest worry was that the battle against inflation, and in turn that between the bulls and bears on Wall Street, wouldn’t end quickly. No, I feared that this might turn into a long slog.
Think 2000 through 2002. Or even 2008-09. No, I’m not suggesting that the current bear is anything like those two exceptionally negative cycles. It is clear that the current bear is a very different animal. However, the bear markets of 00-02 and 08-09 were the last time stocks remained on the defensive for any real length of time. Since then, the bear cycles have tended to be fast and furious – and over pretty quickly. So, unless you have been in the business for at least 14 years, you may not know what a prolonged bear market looks/feels like.
As long-time readers know, I tend to err of the side of the market’s glass being at least half full. However, I learned a long time ago that in Ms. Market’s game, it is important to understand the arguments of both teams. So, this morning, I thought I’d spend a few minutes examining why I am concerned that the current market environment could stay with us for a while.
The Bear Case
By now, probably every investor on the planet can likely recite the bear case. Inflation has remained sticky and does not appear to be transitory. As a result, the Fed will need to remain aggressive and raise rates farther than market players were expecting. This while the economy – especially the global economy – appears to be weakening. Thus, our furry friends in the bear camp suggest that the Fed is going to throw the economy through the windshield as it slams on the brakes. In turn, this means that earnings projections for the Q4 and all of 2023 are likely too high and must come down. And with EPS estimates on the decline, the bears contend that valuations and the multiples applied to stocks must fall as well. Good times.
The Big Worry
My big worry – the one that occasionally keeps me up at night – is that inflation will remain a problem for a protracted length of time. The basis for my fear is that two of the primary components of inflation, wages and shelter, aren’t likely to pull back any time soon – no matter what the Fed says or does.
And that last part is the key. The drivers behind the surge in housing and rent, as well as salaries, are related to changes in consumer behavior that the Fed simply can’t control. Well without wrecking the economy, anyway.
The Surge in Home Prices
If you own a home, you have likely noticed that the value of your humble abode has increased – a lot. While some will argue this is due to the Fed holding interest rates at generational lows for too long (as in, way too long), I believe the real reason for the surge in home prices is tied to COVID and the WFA (work from anywhere) movement.
Although many companies are insisting that workers return to the office full time, there has been a significant shift towards allowing workers the flexibility to do their jobs from home (wherever that may be). Although clearly not everyone will work from home/anywhere going forward, the key is that enough people will be able to skip the office routine to create an enduring shift in demand for single-family homes – especially in those desirable climate areas.
So, despite mortgage rates having more than doubled this year, demand for homes remains high. Again, especially in areas where the weather doesn’t beat you to a pulp 5-6 months out of the year.
Because of the surge in demand, prices have risen – again, a lot. And since demand remains high, prices aren’t falling to any great degree (yet?). This means that being able to afford a home has gotten tougher. This, in turn, creates demand for apartment rentals. Which, yep, you guessed it; means prices for rentals have risen – also by a lot. And don’t look now fans, but according to the stats I follow, rental prices continue to rise. (Why? Oh, that’s right, because demand continues to be higher than supply.)
For those of you keeping score at home, let’s remember that something on the order of 40% of Core CPI (CPI ex food and energy) is attributed to “shelter.” And this means that a healthy chunk of inflation is likely to stay “sticky” for a while.
Wages Are Rising
Then there is the wages situation. Because of COVID, workers have suddenly gained an edge at the negotiating table. So much so that something called the “great resignation” movement continues to unfold. This is where employees quit one job in favor of another, higher paying gig. So, how do companies try to retain workers? Yep, that’s right; they pay them more.
Out of the Fed’s Hands
A key point here is that Jay Powell and his merry band of central bankers can’t do much about the inflation problem for housing and wages, and/or the supply chain issues. Unless the Fed can “destroy” demand for housing and a lot of other stuff folks like to buy, that is.
“Demand Destruction”
The thinking is that by raising rates high enough, the Fed can reduce demand for, well, just about everything. The gameplan is to create enough economic weakness to put the kibosh on the surge in prices and the job hopping/wage increase movement – all without hurting the economy too badly. Good luck, Team Powell!
Unfortunately, the Fed’s track record here isn’t great. Sure, they did manage to “land” the economy softly in the mid-1990s. But other than that, a meaningful recession has resulted whenever the Fed has tried to raise rates in the past.
Hence my uneasiness about the market escaping the current environment anytime soon. You see, rate hikes work through the economy with a rather significant lag in terms of time. As such, we won’t know the impact the Fed’s 2022 rate hikes will have on the economy for quite some time. And the fear is that by the time the Fed sees that they have created enough “demand destruction,” it may be too late.
How Does This End?
The question, of course, is how does all of this end? Cutting to the chase, my thinking is that either the Fed threads the needle beautifully and manages to squelch inflation without sending the economy into the ditch, or stock prices become low enough for investors to ignore the long-term value they represent.
Option A would obviously be the desired result. This would mean investors wouldn’t have to endure another round of “price discovery” to the downside as traders try to find the right prices for stocks relative to the environment. And it would mean that we’ve likley seen the worst of this bear.
Unfortunately, option B would likely include additional downside for stocks. Using back-of-the-napkin EPS multiple math, it looks like a move down to 3200ish on the S&P 500 might do the trick – and would represent a top-to-bottom decline in line with historical averages. Not fun.
So, from my seat, the key here is to recognize that there may not be a quick fix to this inflation problem. Unless there is, of course (remember, the glass could actually wind up being half full)! Maybe Russia calls it quits in Ukraine. Maybe COVID goes away in China. Maybe supply chains get fixed pronto. Maybe the Fed won’t act as tough as they are currently talking. We shall see.
But for now, it is probably best to keep an open mind and remain flexible.
Now let’s review the “state of the market” through the lens of our market models…
The Big-Picture Market Models
We start with six of our favorite long-term market models. These models are designed to help determine the “state” of the overall market.
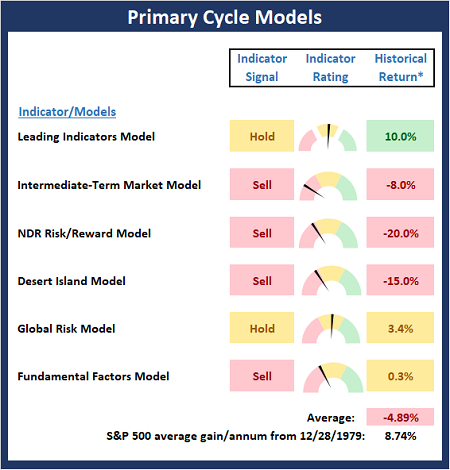
* Source: Ned Davis Research (NDR) as of the date of publication. Historical returns are hypothetical average annual performances calculated by NDR.
The Fundamental Backdrop
Next, we review the market’s fundamental factors including interest rates, the economy, earnings, inflation, and valuations.
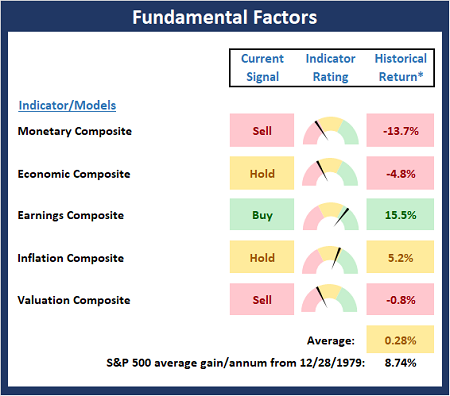
* Source: Ned Davis Research (NDR) as of the date of publication. Historical returns are hypothetical average annual performances calculated by NDR.
The State of the Trend
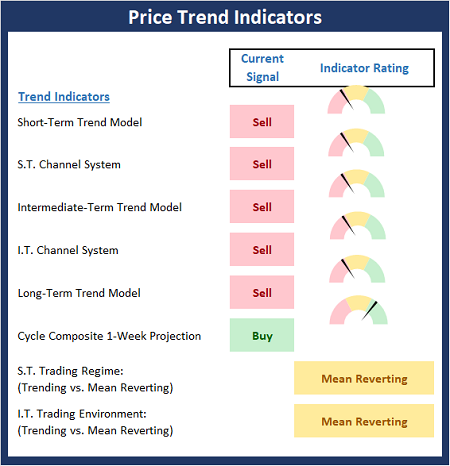
After reviewing the big-picture models and the fundamental backdrop, I like to look at the state of the current trend. This board of indicators is designed to tell us about the overall technical health of the market’s trend.
The State of Internal Momentum
Next, we analyze the momentum indicators/models to determine if there is any “oomph” behind the current move.
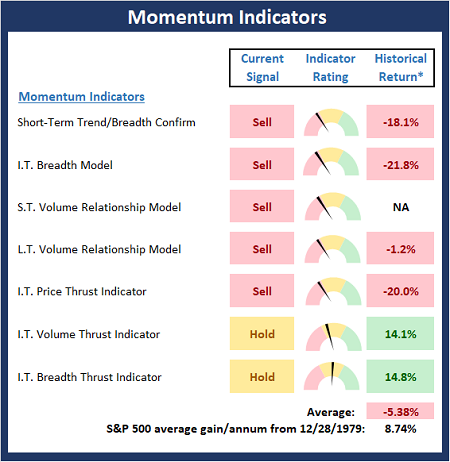
* Source: Ned Davis Research (NDR) as of the date of publication. Historical returns are hypothetical average annual performances calculated by NDR.
Early Warning Indicators
Finally, we look at our early warning indicators to gauge the potential for countertrend moves. This batch of indicators is designed to suggest when the table is set for the trend to “go the other way.”
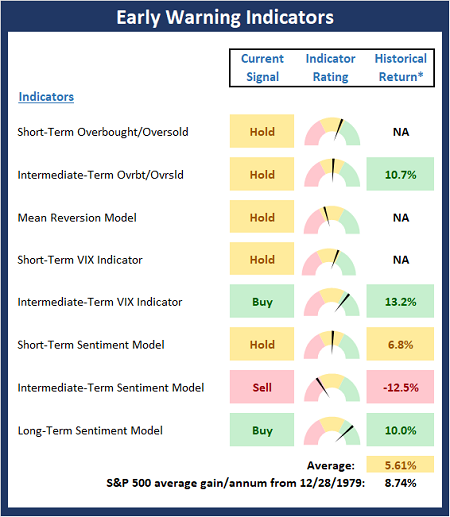
* Source: Ned Davis Research (NDR) as of the date of publication. Historical returns are hypothetical average annual performances calculated by NDR.
Thought for the Day:
What worries you masters you. -Unknown
Market Models Explained
Wishing you green screens and all the best for a great day,

David D. Moenning
Director Institutional Consulting
Capital Advisors 360, LLC

Disclosures
At the time of publication, Mr. Moenning held long positions in the following securities mentioned:
none
– Note that positions may change at any time.
NOT INDIVIDUAL INVESTMENT ADVICE. IMPORTANT FURTHER DISCLOSURES
Tags: David Moenning, State of the Markets, Stock Market, Stocks, Stock Market Commentary, Stock Market Analysis, Investing


Institutional Consulting
David Moenning
A Long Slog?
About a month ago – you know, back when stocks were making “higher highs,” new buy signals were flashing, and everybody was thinking that we’d seen the worst of the bear market – I remarked privately to a couple colleagues that while things were going well at the time, my biggest worry was that the battle against inflation, and in turn that between the bulls and bears on Wall Street, wouldn’t end quickly. No, I feared that this might turn into a long slog.
Think 2000 through 2002. Or even 2008-09. No, I’m not suggesting that the current bear is anything like those two exceptionally negative cycles. It is clear that the current bear is a very different animal. However, the bear markets of 00-02 and 08-09 were the last time stocks remained on the defensive for any real length of time. Since then, the bear cycles have tended to be fast and furious – and over pretty quickly. So, unless you have been in the business for at least 14 years, you may not know what a prolonged bear market looks/feels like.
As long-time readers know, I tend to err of the side of the market’s glass being at least half full. However, I learned a long time ago that in Ms. Market’s game, it is important to understand the arguments of both teams. So, this morning, I thought I’d spend a few minutes examining why I am concerned that the current market environment could stay with us for a while.
The Bear Case
By now, probably every investor on the planet can likely recite the bear case. Inflation has remained sticky and does not appear to be transitory. As a result, the Fed will need to remain aggressive and raise rates farther than market players were expecting. This while the economy – especially the global economy – appears to be weakening. Thus, our furry friends in the bear camp suggest that the Fed is going to throw the economy through the windshield as it slams on the brakes. In turn, this means that earnings projections for the Q4 and all of 2023 are likely too high and must come down. And with EPS estimates on the decline, the bears contend that valuations and the multiples applied to stocks must fall as well. Good times.
The Big Worry
My big worry – the one that occasionally keeps me up at night – is that inflation will remain a problem for a protracted length of time. The basis for my fear is that two of the primary components of inflation, wages and shelter, aren’t likely to pull back any time soon – no matter what the Fed says or does.
And that last part is the key. The drivers behind the surge in housing and rent, as well as salaries, are related to changes in consumer behavior that the Fed simply can’t control. Well without wrecking the economy, anyway.
The Surge in Home Prices
If you own a home, you have likely noticed that the value of your humble abode has increased – a lot. While some will argue this is due to the Fed holding interest rates at generational lows for too long (as in, way too long), I believe the real reason for the surge in home prices is tied to COVID and the WFA (work from anywhere) movement.
Although many companies are insisting that workers return to the office full time, there has been a significant shift towards allowing workers the flexibility to do their jobs from home (wherever that may be). Although clearly not everyone will work from home/anywhere going forward, the key is that enough people will be able to skip the office routine to create an enduring shift in demand for single-family homes – especially in those desirable climate areas.
So, despite mortgage rates having more than doubled this year, demand for homes remains high. Again, especially in areas where the weather doesn’t beat you to a pulp 5-6 months out of the year.
Because of the surge in demand, prices have risen – again, a lot. And since demand remains high, prices aren’t falling to any great degree (yet?). This means that being able to afford a home has gotten tougher. This, in turn, creates demand for apartment rentals. Which, yep, you guessed it; means prices for rentals have risen – also by a lot. And don’t look now fans, but according to the stats I follow, rental prices continue to rise. (Why? Oh, that’s right, because demand continues to be higher than supply.)
For those of you keeping score at home, let’s remember that something on the order of 40% of Core CPI (CPI ex food and energy) is attributed to “shelter.” And this means that a healthy chunk of inflation is likely to stay “sticky” for a while.
Wages Are Rising
Then there is the wages situation. Because of COVID, workers have suddenly gained an edge at the negotiating table. So much so that something called the “great resignation” movement continues to unfold. This is where employees quit one job in favor of another, higher paying gig. So, how do companies try to retain workers? Yep, that’s right; they pay them more.
Out of the Fed’s Hands
A key point here is that Jay Powell and his merry band of central bankers can’t do much about the inflation problem for housing and wages, and/or the supply chain issues. Unless the Fed can “destroy” demand for housing and a lot of other stuff folks like to buy, that is.
“Demand Destruction”
The thinking is that by raising rates high enough, the Fed can reduce demand for, well, just about everything. The gameplan is to create enough economic weakness to put the kibosh on the surge in prices and the job hopping/wage increase movement – all without hurting the economy too badly. Good luck, Team Powell!
Unfortunately, the Fed’s track record here isn’t great. Sure, they did manage to “land” the economy softly in the mid-1990s. But other than that, a meaningful recession has resulted whenever the Fed has tried to raise rates in the past.
Hence my uneasiness about the market escaping the current environment anytime soon. You see, rate hikes work through the economy with a rather significant lag in terms of time. As such, we won’t know the impact the Fed’s 2022 rate hikes will have on the economy for quite some time. And the fear is that by the time the Fed sees that they have created enough “demand destruction,” it may be too late.
How Does This End?
The question, of course, is how does all of this end? Cutting to the chase, my thinking is that either the Fed threads the needle beautifully and manages to squelch inflation without sending the economy into the ditch, or stock prices become low enough for investors to ignore the long-term value they represent.
Option A would obviously be the desired result. This would mean investors wouldn’t have to endure another round of “price discovery” to the downside as traders try to find the right prices for stocks relative to the environment. And it would mean that we’ve likley seen the worst of this bear.
Unfortunately, option B would likely include additional downside for stocks. Using back-of-the-napkin EPS multiple math, it looks like a move down to 3200ish on the S&P 500 might do the trick – and would represent a top-to-bottom decline in line with historical averages. Not fun.
So, from my seat, the key here is to recognize that there may not be a quick fix to this inflation problem. Unless there is, of course (remember, the glass could actually wind up being half full)! Maybe Russia calls it quits in Ukraine. Maybe COVID goes away in China. Maybe supply chains get fixed pronto. Maybe the Fed won’t act as tough as they are currently talking. We shall see.
But for now, it is probably best to keep an open mind and remain flexible.
Now let’s review the “state of the market” through the lens of our market models…
The Big-Picture Market Models
We start with six of our favorite long-term market models. These models are designed to help determine the “state” of the overall market.
* Source: Ned Davis Research (NDR) as of the date of publication. Historical returns are hypothetical average annual performances calculated by NDR.
The Fundamental Backdrop
Next, we review the market’s fundamental factors including interest rates, the economy, earnings, inflation, and valuations.
* Source: Ned Davis Research (NDR) as of the date of publication. Historical returns are hypothetical average annual performances calculated by NDR.
The State of the Trend
After reviewing the big-picture models and the fundamental backdrop, I like to look at the state of the current trend. This board of indicators is designed to tell us about the overall technical health of the market’s trend.
The State of Internal Momentum
Next, we analyze the momentum indicators/models to determine if there is any “oomph” behind the current move.
* Source: Ned Davis Research (NDR) as of the date of publication. Historical returns are hypothetical average annual performances calculated by NDR.
Early Warning Indicators
Finally, we look at our early warning indicators to gauge the potential for countertrend moves. This batch of indicators is designed to suggest when the table is set for the trend to “go the other way.”
* Source: Ned Davis Research (NDR) as of the date of publication. Historical returns are hypothetical average annual performances calculated by NDR.
Thought for the Day:
What worries you masters you. -Unknown
Market Models Explained
Wishing you green screens and all the best for a great day,
David D. Moenning
Director Institutional Consulting
Capital Advisors 360, LLC
Disclosures
At the time of publication, Mr. Moenning held long positions in the following securities mentioned:
none
– Note that positions may change at any time.
NOT INDIVIDUAL INVESTMENT ADVICE. IMPORTANT FURTHER DISCLOSURES
Tags: David Moenning, State of the Markets, Stock Market, Stocks, Stock Market Commentary, Stock Market Analysis, Investing
RECENT ARTICLES
The Time Has Come
The Market Panic Playbook
Bears Get Back In The Game
Sell in May, Except…
When Being Completely Wrong Works Out
Stronger For Longer?
Archives
Archives