The State of the Market
Long-time readers know that there are times when I believe there is a message to be gleaned from the intraday market action. To be sure, this is not the case every single day the stock market is open. Many times, the action should be viewed as simply a continuation of the trend in place or just noise. However, I think Tuesday’s action was interesting and potentially provided a “tell” with regard to what could come next.
There are two things I’ve been paying particularly close attention to of late: (1) The potential upside breakout from the recent trading range. And (2) the “rotation trade” from the megacap growth names to the smaller cap, cyclical, and/or value plays. And from my perch, yesterday provided some information on both topics.
On the subject of the breakout, it does appear that there is at least a modest skirmish between the two teams taking place. While the S&P 500 did manage to remain above the all-important breakout level (3580ish), it was definitely a struggle. So, instead of the market looking like a runaway train, as it had on Friday/Monday, it now appears that the venerable S&P is taking a breather.
The question, of course, is whether this will become a “pause that refreshes” (think of a runner slowing down a bit during the race to catch his/her breath before making the next surge) or a prelude to the dreaded “breakout fake-out?”
For clues to the answer, I like to look at the rest of the major indices – especially the leaders. So, in scanning the charts of the Dow, NDX, Smallcap, and Midcap indices, I find that while the Dow and NASDAQ 100 also appear to be struggling to advance, the small and midcap indices are continuing to march higher. Then when I drilled down into factor-land, I found that the ETF proxies for the value and size factors are also “movin’ on up” in fine fashion.
Which brings me to the second issue I’ve been watching closely: The status of the “rotation trade.”
Anyone paying close attention to the game knows that this trade has experienced several false starts this year. To date, the “Covid losers” have enjoyed a mean reversion trade for a few days and then just about the time you thought you needed to take action, the move was over and traders returned to the “Covid winners” trade.
However, this time around, things look different. As in the rotation trade looks real and could easily stick around awhile. The reasoning can be summed up in one word: vaccines. Cutting to the chase, with a minimum of two highly effective vaccines on the horizon, investors can start discounting a return toward more “normal” economic conditions.
So, with the new leaders marching higher, creating a positive divergence with the blue chip indices in the process, my take is the “generals” of the S&P 500 will likely follow the lead of the “troops” at some point.
Now let’s take a look at what our Early Warning indicator board tells us about the near-term outlook…
The State of the “Early Warning” Indicators
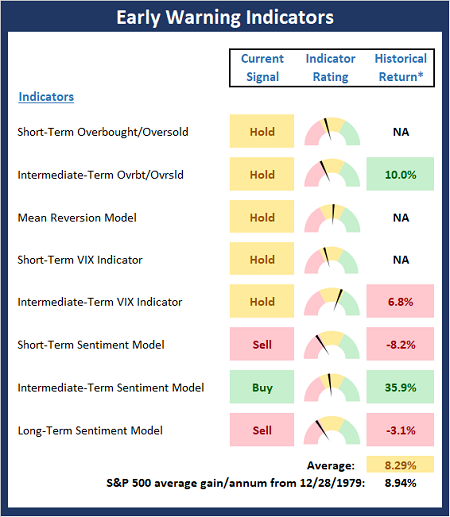
While not in a “table pounding” mode at the present time, it does appear that the Early Warning board is telling us to be on high alert. I see two potential outcomes. First, given the overbought (see the readings of the first 5 indicators on the board) and overbelieved (see sentiment indicators) condition, a reversal to the downside is certainly possible. The second outcome, which I favor here, is that we’re seeing what I like to call a “good overbought” condition developing. Stay tuned.

* Source: Ned Davis Research (NDR) as of the date of publication. Historical returns are hypothetical average annual performances calculated by NDR.
Stochastic Review
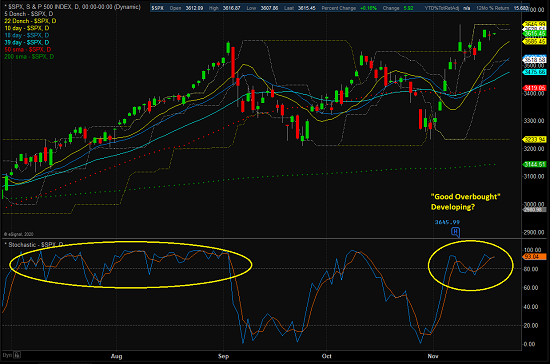
As I mentioned above, my key question at this point is if the market will be able to move to a “good overbought” condition. As such, the onus will be on the bears to try and get some sort of dance to the downside going. If they can’t make this happen in the next week or so, I’d expect the bulls to resume their move higher.
S&P 500 – Daily

View Full Size Chart Online
Thought For The Day:
Look at everything as though you were seeing it either for the first or last time. -Betty Smith
Market Models Explained
Wishing you green screens and all the best for a great day,

David D. Moenning
Director Institutional Consulting
Capital Advisors 360, LLC

Disclosures
At the time of publication, Mr. Moenning held long positions in the following securities mentioned:
none
– Note that positions may change at any time.
NOT INDIVIDUAL INVESTMENT ADVICE. IMPORTANT FURTHER DISCLOSURES


Institutional Consulting
David Moenning
A Good Overbought Condition? Or…
The State of the Market
Long-time readers know that there are times when I believe there is a message to be gleaned from the intraday market action. To be sure, this is not the case every single day the stock market is open. Many times, the action should be viewed as simply a continuation of the trend in place or just noise. However, I think Tuesday’s action was interesting and potentially provided a “tell” with regard to what could come next.
There are two things I’ve been paying particularly close attention to of late: (1) The potential upside breakout from the recent trading range. And (2) the “rotation trade” from the megacap growth names to the smaller cap, cyclical, and/or value plays. And from my perch, yesterday provided some information on both topics.
On the subject of the breakout, it does appear that there is at least a modest skirmish between the two teams taking place. While the S&P 500 did manage to remain above the all-important breakout level (3580ish), it was definitely a struggle. So, instead of the market looking like a runaway train, as it had on Friday/Monday, it now appears that the venerable S&P is taking a breather.
The question, of course, is whether this will become a “pause that refreshes” (think of a runner slowing down a bit during the race to catch his/her breath before making the next surge) or a prelude to the dreaded “breakout fake-out?”
For clues to the answer, I like to look at the rest of the major indices – especially the leaders. So, in scanning the charts of the Dow, NDX, Smallcap, and Midcap indices, I find that while the Dow and NASDAQ 100 also appear to be struggling to advance, the small and midcap indices are continuing to march higher. Then when I drilled down into factor-land, I found that the ETF proxies for the value and size factors are also “movin’ on up” in fine fashion.
Which brings me to the second issue I’ve been watching closely: The status of the “rotation trade.”
Anyone paying close attention to the game knows that this trade has experienced several false starts this year. To date, the “Covid losers” have enjoyed a mean reversion trade for a few days and then just about the time you thought you needed to take action, the move was over and traders returned to the “Covid winners” trade.
However, this time around, things look different. As in the rotation trade looks real and could easily stick around awhile. The reasoning can be summed up in one word: vaccines. Cutting to the chase, with a minimum of two highly effective vaccines on the horizon, investors can start discounting a return toward more “normal” economic conditions.
So, with the new leaders marching higher, creating a positive divergence with the blue chip indices in the process, my take is the “generals” of the S&P 500 will likely follow the lead of the “troops” at some point.
Now let’s take a look at what our Early Warning indicator board tells us about the near-term outlook…
The State of the “Early Warning” Indicators
While not in a “table pounding” mode at the present time, it does appear that the Early Warning board is telling us to be on high alert. I see two potential outcomes. First, given the overbought (see the readings of the first 5 indicators on the board) and overbelieved (see sentiment indicators) condition, a reversal to the downside is certainly possible. The second outcome, which I favor here, is that we’re seeing what I like to call a “good overbought” condition developing. Stay tuned.
* Source: Ned Davis Research (NDR) as of the date of publication. Historical returns are hypothetical average annual performances calculated by NDR.
Stochastic Review
As I mentioned above, my key question at this point is if the market will be able to move to a “good overbought” condition. As such, the onus will be on the bears to try and get some sort of dance to the downside going. If they can’t make this happen in the next week or so, I’d expect the bulls to resume their move higher.
S&P 500 – Daily

View Full Size Chart Online
Thought For The Day:
Look at everything as though you were seeing it either for the first or last time. -Betty Smith
Market Models Explained
Wishing you green screens and all the best for a great day,
David D. Moenning
Director Institutional Consulting
Capital Advisors 360, LLC
Disclosures
At the time of publication, Mr. Moenning held long positions in the following securities mentioned:
none
– Note that positions may change at any time.
NOT INDIVIDUAL INVESTMENT ADVICE. IMPORTANT FURTHER DISCLOSURES
RECENT ARTICLES
The Time Has Come
The Market Panic Playbook
Bears Get Back In The Game
Sell in May, Except…
When Being Completely Wrong Works Out
Stronger For Longer?
Archives
Archives