The key data points the markets received were mixed last week on both the economic and earnings fronts. For example, while Consumer Confidence was up, the first read of Q3 GDP was weaker than expected. And while the likes of Amazon (AMZN), Starbucks (SBUX), and Apple (AAPL) reports disappointed, the earnings season as a whole has been better than expected (again).
On that note, it is worth recognizing that, according to Refinitiv, with 56% of the companies in the S&P 500 having reported, EPS growth for Q3 is expected to have increased by 39.2%, which is up from last week’s reading of 34.8%. In addition, 82.1% of the 279 companies that updated results have beaten expectations. Finally, revenue growth for the quarter is forecast to be up 15.1% over the same period last year, which, again, is above last week’s projection of 14.3%.
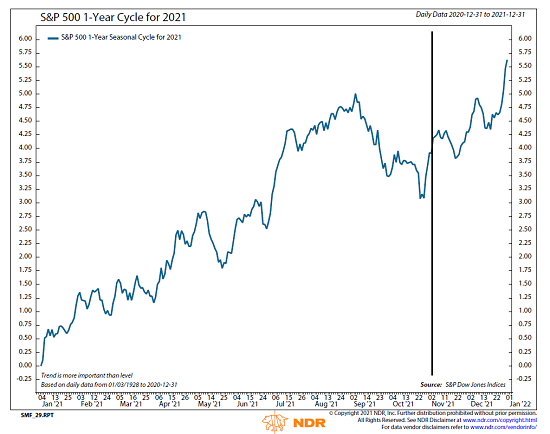
In short, investors appear to be looking on the bright side and sticking to the historical seasonal cycle script. Speaking of which, the 1-year historical pattern for the S&P 500 suggests that there is more upside to come before the champagne starts to flow on New Year’s Eve. See below.
View Full Size Chart
* Source: Ned Davis Research
According to Ned Davis Research, in years when the S&P 500 has been up 20% or more through the end of October, the median gain for the November-December period has been +6%, which is almost double the average Nov-Dec period’s gain of 3.4%. Oh, and the last time the S&P 500 was down in the final two months of the year when it had been up 20% through October was… wait for it… 1943.
Looking ahead, the big events this week include another avalanche of earnings and the November Fed meeting.
On Wednesday, Jay Powell is expected to announce that the FOMC will begin “tapering” its QE program. The consensus thinking is the Fed will cut their bond buying back by $20 billion a month each month for the next six months. If implemented, such a plan would mean the Fed would be out of the bond market within six months.
While this move has been well telegraphed and is widely anticipated by markets around the globe, investors will be listening intently for hints regarding the Fed’s view on inflation as well as any mention of when Powell’s bunch will begin raising interest rates.
Now let’s get the new week started with a review the “state of the market” from a model perspective…
The Big-Picture Market Models
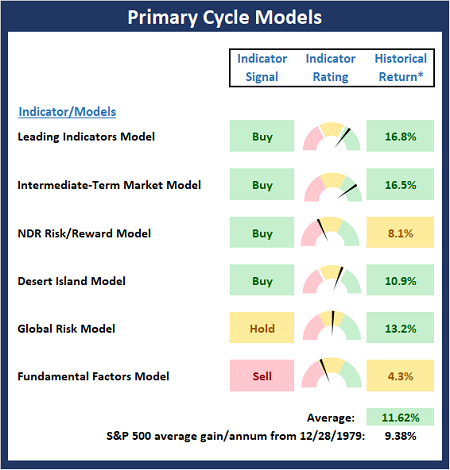
We start with six of our favorite long-term market models. These models are designed to help determine the “state” of the overall market.
* Source: Ned Davis Research (NDR) as of the date of publication. Historical returns are hypothetical average annual performances calculated by NDR.
Current Take: Big Picture Models
There are no changes to Primary Cycle Board this week. The overall message from the big-picture market models is that this is a bull market until proven otherwise.
The Fundamental Backdrop
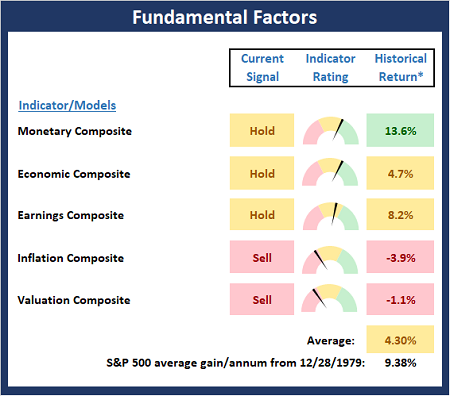
Next, we review the market’s fundamental factors including interest rates, the economy, earnings, inflation, and valuations.
* Source: Ned Davis Research (NDR) as of the date of publication. Historical returns are hypothetical average annual performances calculated by NDR.
Current Take: Fundamental Models
There were no changes to the Fundamental Board this week. The fact that there is no green on the board suggests that while the bulls remain in control, this is NOT a low-risk environment.
The State of the Trend
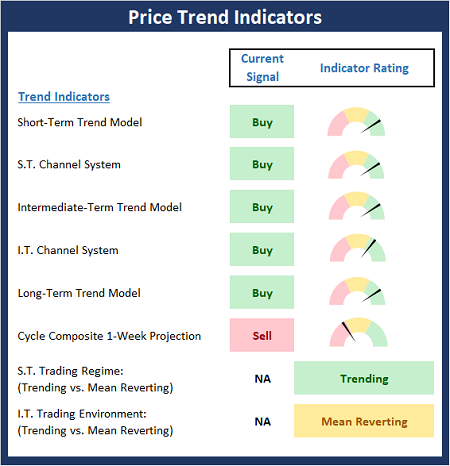
After reviewing the big-picture models and the fundamental backdrop, I like to look at the state of the current trend. This board of indicators is designed to tell us about the overall technical health of the market’s trend.
Current Take: Trend Models
With the S&P moving to fresh all-time highs, it isn’t surprising that the Trend Board improved a bit last week. The Short-Term Trading Regime moved from mean-reverting to trending. Bottom Line: The bulls remain in control.
The State of Internal Momentum
Next, we analyze the momentum indicators/models to determine if there is any “oomph” behind the current move.
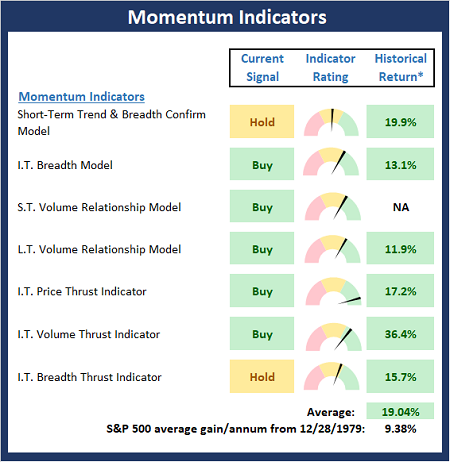
* Source: Ned Davis Research (NDR) as of the date of publication. Historical returns are hypothetical average annual performances calculated by NDR.
Current Take: Momentum Models
The Momentum Board experienced a slight downtick last week as the Short-Term Trend & Breadth confirm model slipped to neutral. However, I expect this to flip back to positive shortly. Bottom Line: The board suggests the bulls have “mo” on their side.
Early Warning Indicators
Finally, we look at our early warning indicators to gauge the potential for countertrend moves. This batch of indicators is designed to suggest when the table is set for the trend to “go the other way.”
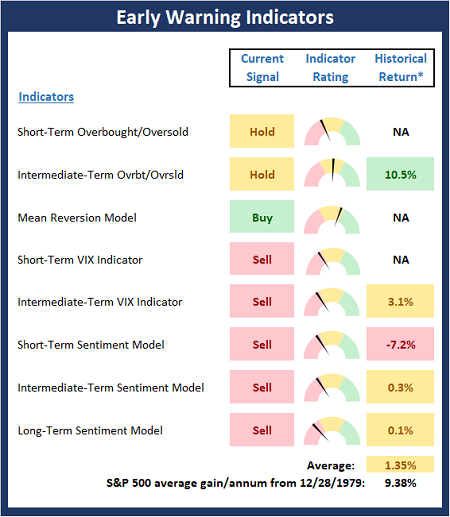
* Source: Ned Davis Research (NDR) as of the date of publication. Historical returns are hypothetical average annual performances calculated by NDR.
Current Take: Early Warning Models
The Early Warning Board has now moved into the “get ready for a countertrend move” state. While the board can stay in such a state for long periods of time, active investors will want to be on the lookout for a pause in the upside trend.
Thought for the Day:
Partial truth is the enemy’s biggest weapon. -Ross McKnight
Market Models Explained
Wishing you green screens and all the best for a great day,

David D. Moenning
Director Institutional Consulting
Capital Advisors 360, LLC

Disclosures
At the time of publication, Mr. Moenning held long positions in the following securities mentioned:
AMZN, AAPL, SBUX
– Note that positions may change at any time.
NOT INDIVIDUAL INVESTMENT ADVICE. IMPORTANT FURTHER DISCLOSURES
Tags: David Moenning, State of the Markets, Stock Market, Stocks, Stock Market Commentary, Stock Market Analysis, Investing


Institutional Consulting
David Moenning
Looking On The Bright Side
The key data points the markets received were mixed last week on both the economic and earnings fronts. For example, while Consumer Confidence was up, the first read of Q3 GDP was weaker than expected. And while the likes of Amazon (AMZN), Starbucks (SBUX), and Apple (AAPL) reports disappointed, the earnings season as a whole has been better than expected (again).
On that note, it is worth recognizing that, according to Refinitiv, with 56% of the companies in the S&P 500 having reported, EPS growth for Q3 is expected to have increased by 39.2%, which is up from last week’s reading of 34.8%. In addition, 82.1% of the 279 companies that updated results have beaten expectations. Finally, revenue growth for the quarter is forecast to be up 15.1% over the same period last year, which, again, is above last week’s projection of 14.3%.
In short, investors appear to be looking on the bright side and sticking to the historical seasonal cycle script. Speaking of which, the 1-year historical pattern for the S&P 500 suggests that there is more upside to come before the champagne starts to flow on New Year’s Eve. See below.
View Full Size Chart
* Source: Ned Davis Research
According to Ned Davis Research, in years when the S&P 500 has been up 20% or more through the end of October, the median gain for the November-December period has been +6%, which is almost double the average Nov-Dec period’s gain of 3.4%. Oh, and the last time the S&P 500 was down in the final two months of the year when it had been up 20% through October was… wait for it… 1943.
Looking ahead, the big events this week include another avalanche of earnings and the November Fed meeting.
On Wednesday, Jay Powell is expected to announce that the FOMC will begin “tapering” its QE program. The consensus thinking is the Fed will cut their bond buying back by $20 billion a month each month for the next six months. If implemented, such a plan would mean the Fed would be out of the bond market within six months.
While this move has been well telegraphed and is widely anticipated by markets around the globe, investors will be listening intently for hints regarding the Fed’s view on inflation as well as any mention of when Powell’s bunch will begin raising interest rates.
Now let’s get the new week started with a review the “state of the market” from a model perspective…
The Big-Picture Market Models
We start with six of our favorite long-term market models. These models are designed to help determine the “state” of the overall market.
* Source: Ned Davis Research (NDR) as of the date of publication. Historical returns are hypothetical average annual performances calculated by NDR.
Current Take: Big Picture Models
There are no changes to Primary Cycle Board this week. The overall message from the big-picture market models is that this is a bull market until proven otherwise.
The Fundamental Backdrop
Next, we review the market’s fundamental factors including interest rates, the economy, earnings, inflation, and valuations.
* Source: Ned Davis Research (NDR) as of the date of publication. Historical returns are hypothetical average annual performances calculated by NDR.
Current Take: Fundamental Models
There were no changes to the Fundamental Board this week. The fact that there is no green on the board suggests that while the bulls remain in control, this is NOT a low-risk environment.
The State of the Trend
After reviewing the big-picture models and the fundamental backdrop, I like to look at the state of the current trend. This board of indicators is designed to tell us about the overall technical health of the market’s trend.
Current Take: Trend Models
With the S&P moving to fresh all-time highs, it isn’t surprising that the Trend Board improved a bit last week. The Short-Term Trading Regime moved from mean-reverting to trending. Bottom Line: The bulls remain in control.
The State of Internal Momentum
Next, we analyze the momentum indicators/models to determine if there is any “oomph” behind the current move.
* Source: Ned Davis Research (NDR) as of the date of publication. Historical returns are hypothetical average annual performances calculated by NDR.
Current Take: Momentum Models
The Momentum Board experienced a slight downtick last week as the Short-Term Trend & Breadth confirm model slipped to neutral. However, I expect this to flip back to positive shortly. Bottom Line: The board suggests the bulls have “mo” on their side.
Early Warning Indicators
Finally, we look at our early warning indicators to gauge the potential for countertrend moves. This batch of indicators is designed to suggest when the table is set for the trend to “go the other way.”
* Source: Ned Davis Research (NDR) as of the date of publication. Historical returns are hypothetical average annual performances calculated by NDR.
Current Take: Early Warning Models
The Early Warning Board has now moved into the “get ready for a countertrend move” state. While the board can stay in such a state for long periods of time, active investors will want to be on the lookout for a pause in the upside trend.
Thought for the Day:
Partial truth is the enemy’s biggest weapon. -Ross McKnight
Market Models Explained
Wishing you green screens and all the best for a great day,
David D. Moenning
Director Institutional Consulting
Capital Advisors 360, LLC
Disclosures
At the time of publication, Mr. Moenning held long positions in the following securities mentioned:
AMZN, AAPL, SBUX
– Note that positions may change at any time.
NOT INDIVIDUAL INVESTMENT ADVICE. IMPORTANT FURTHER DISCLOSURES
Tags: David Moenning, State of the Markets, Stock Market, Stocks, Stock Market Commentary, Stock Market Analysis, Investing
RECENT ARTICLES
The Time Has Come
The Market Panic Playbook
Bears Get Back In The Game
Sell in May, Except…
When Being Completely Wrong Works Out
Stronger For Longer?
Archives
Archives