The State of the Market: Executive Summary
One week ago, uncertainty reigned supreme as traders fretted over earnings, COVID, the economy, and of course, the election. After what so far qualifies as a garden-variety correction, which has seen the S&P fall about 7% from its recent high, stocks have turned around in the early going this week. And if you find yourself scratching your head over the action, I can’t blame you.
However, in my experience, once the market (a) comes to grips with the outlook for the future or (b) realizes that the uncertainties themselves are removed, a sigh of relief tends to occur. And from my seat, that is what we are seeing in the market so far this week.
No, we don’t know the outcome of the election. However, the expectations appear to be set. And then, more importantly, the uncertainty surrounding earnings (especially the earnings of the megacap tech names we’ve all come to know and love) as well as the state of the economy have been removed – to some degree.
For example, we now know what is happening with the earnings for the leading companies in cell phones, streaming, search, online shopping, and social media. And while the stocks of the big names have pulled back since reporting, the outlook is less uncertain now that we know what the current earnings look like.
In addition, this week’s ISM Manufacturing numbers, which indicate the state of the manufacturing economy, definitely surprised to the upside. As such, some of the fear of the economy taking another dive may have diminished a bit.
And then there is the election, itself. I understand that this is one of the most emotional elections in history and that we may not know the outcome for several days. But here’s the key – the stock market doesn’t care. At least historically, that is.
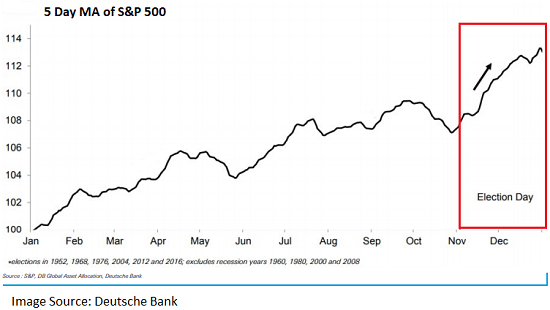
Take a look at the chart below put together by Deutsche Bank. The key takeaway is that in election years since 1952, stocks have rallied nicely after election day into the end of the year – REGARDLESS OF WHO WINS.

View Larger Chart
Turning to this election, I will opine that traders came into this week remembering that although uncertainties/fears remain, there are still a couple ginormous positives out there. Namely, fiscal stimulus and Fed support. And the bottom line is that the closer we get to the post-election period and/or January 2021, the more likely it is for stimulus to occur. ‘Nuf said.
The State of the Trend Indicators
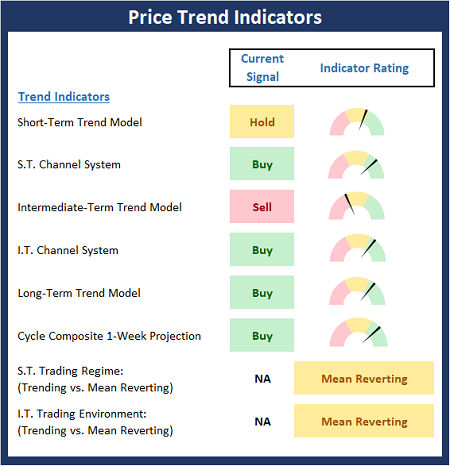
Although the price action turned ugly last week, the Trend Board looks to be in decent shape as of this writing. This gives me hope that we’ve seen the worst of the corrective phase. However, I think it is naive to think that the recent spike volatility is over.

NOT INDIVIDUAL INVESTMENT ADVICE.
About The Trend Board Indicators: The models/indicators on the Trend Board are designed to determine the overall technical health of the current stock market trend in terms of the short- and intermediate-term time frames.
My Take on the State of the Charts…
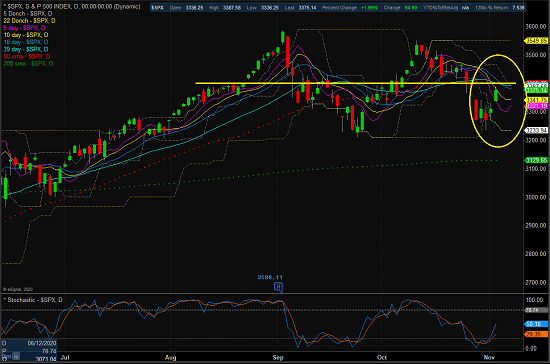
Looking at a chart of the S&P 500, it is clear to me that the market remains in a consolidation phase. The good news is that so far at least, there is a “higher low” on the charts and the oversold condition has started to reverse, which for short-term traders is a signal to get back in the game. The bad news is that stocks are now bumping into overhead resistance from a near-term perspective and stuck in a range from an intermediate-term view. As such, the real key going forward will be a breakout of the range.
S&P 500 – Daily

View Larger Chart
Next, let’s check in on the state of the market’s internal momentum indicators.
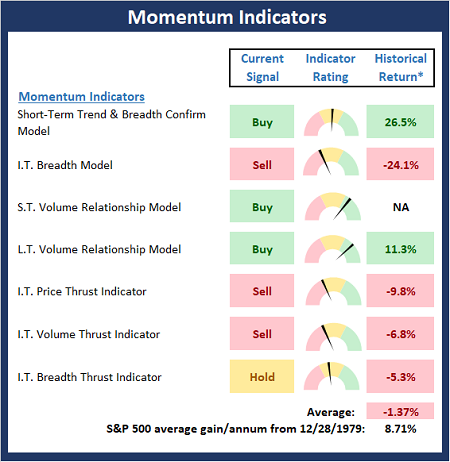
Not surprisingly, the Momentum board has faltered a bit since our last report. But, with 3 buy signals, 3 sell signals, and 1 hold, I’ll call the board neutral here. For me, the Volume Relationship models hold the key to the game. So, as long as there is more demand volume than supply volume, the bulls remain in good shape.

* Source: Ned Davis Research (NDR) as of the date of publication. Historical returns are hypothetical average annual performances calculated by NDR. Past performances do not guarantee future results or profitability – NOT INDIVIDUAL INVESTMENT ADVICE.
Thought For The Day:
The creation of a thousand forests is in one acorn. -Ralph Waldo Emerson
Market Models Explained
Wishing you green screens and all the best for a great day,

David D. Moenning
Director Institutional Consulting
Capital Advisors 360, LLC

Disclosures — At the time of publication, Mr. Moenning held long positions in the following securities mentioned:
NONE — please note that positions may change at any time.
NOT INDIVIDUAL INVESTMENT ADVICE. Important further disclosures and model explanations.


Institutional Consulting
David Moenning
Do Stocks Care About The Election?
The State of the Market: Executive Summary
One week ago, uncertainty reigned supreme as traders fretted over earnings, COVID, the economy, and of course, the election. After what so far qualifies as a garden-variety correction, which has seen the S&P fall about 7% from its recent high, stocks have turned around in the early going this week. And if you find yourself scratching your head over the action, I can’t blame you.
However, in my experience, once the market (a) comes to grips with the outlook for the future or (b) realizes that the uncertainties themselves are removed, a sigh of relief tends to occur. And from my seat, that is what we are seeing in the market so far this week.
No, we don’t know the outcome of the election. However, the expectations appear to be set. And then, more importantly, the uncertainty surrounding earnings (especially the earnings of the megacap tech names we’ve all come to know and love) as well as the state of the economy have been removed – to some degree.
For example, we now know what is happening with the earnings for the leading companies in cell phones, streaming, search, online shopping, and social media. And while the stocks of the big names have pulled back since reporting, the outlook is less uncertain now that we know what the current earnings look like.
In addition, this week’s ISM Manufacturing numbers, which indicate the state of the manufacturing economy, definitely surprised to the upside. As such, some of the fear of the economy taking another dive may have diminished a bit.
And then there is the election, itself. I understand that this is one of the most emotional elections in history and that we may not know the outcome for several days. But here’s the key – the stock market doesn’t care. At least historically, that is.
Take a look at the chart below put together by Deutsche Bank. The key takeaway is that in election years since 1952, stocks have rallied nicely after election day into the end of the year – REGARDLESS OF WHO WINS.
View Larger Chart
Turning to this election, I will opine that traders came into this week remembering that although uncertainties/fears remain, there are still a couple ginormous positives out there. Namely, fiscal stimulus and Fed support. And the bottom line is that the closer we get to the post-election period and/or January 2021, the more likely it is for stimulus to occur. ‘Nuf said.
The State of the Trend Indicators
Although the price action turned ugly last week, the Trend Board looks to be in decent shape as of this writing. This gives me hope that we’ve seen the worst of the corrective phase. However, I think it is naive to think that the recent spike volatility is over.
NOT INDIVIDUAL INVESTMENT ADVICE.
About The Trend Board Indicators: The models/indicators on the Trend Board are designed to determine the overall technical health of the current stock market trend in terms of the short- and intermediate-term time frames.
My Take on the State of the Charts…
Looking at a chart of the S&P 500, it is clear to me that the market remains in a consolidation phase. The good news is that so far at least, there is a “higher low” on the charts and the oversold condition has started to reverse, which for short-term traders is a signal to get back in the game. The bad news is that stocks are now bumping into overhead resistance from a near-term perspective and stuck in a range from an intermediate-term view. As such, the real key going forward will be a breakout of the range.
S&P 500 – Daily

View Larger Chart
Next, let’s check in on the state of the market’s internal momentum indicators.
Not surprisingly, the Momentum board has faltered a bit since our last report. But, with 3 buy signals, 3 sell signals, and 1 hold, I’ll call the board neutral here. For me, the Volume Relationship models hold the key to the game. So, as long as there is more demand volume than supply volume, the bulls remain in good shape.
* Source: Ned Davis Research (NDR) as of the date of publication. Historical returns are hypothetical average annual performances calculated by NDR. Past performances do not guarantee future results or profitability – NOT INDIVIDUAL INVESTMENT ADVICE.
Thought For The Day:
The creation of a thousand forests is in one acorn. -Ralph Waldo Emerson
Market Models Explained
Wishing you green screens and all the best for a great day,
David D. Moenning
Director Institutional Consulting
Capital Advisors 360, LLC
Disclosures — At the time of publication, Mr. Moenning held long positions in the following securities mentioned:
NONE — please note that positions may change at any time.
NOT INDIVIDUAL INVESTMENT ADVICE. Important further disclosures and model explanations.
RECENT ARTICLES
The Time Has Come
The Market Panic Playbook
Bears Get Back In The Game
Sell in May, Except…
When Being Completely Wrong Works Out
Stronger For Longer?
Archives
Archives